


CNBC EUROPE
LET'S LOOK AT THE FTSE DAILY CHART

Last week I indicated it would be very bullish if the move down held the price level of the previous high. I said I didn't believe it would hold that level but spike down to 5042. If I was wrong it would go to 5012, but that was the only risk I could see. The index stopped at 5046 and was within 4 points of the objective. Since that objective was only ¼ of the range it kept the trend in a strong position for the next rally. The objective for the move up is between 5313 and 5360. With some resistance possible at 5160 to 5179 and 5224. Actually 5224 could be very important resistance and the pattern of trend approaching that price level will be important.
The last week in July is the best time I have for this leg up to terminate. Friday's range was quite large and should be consolidated with some smaller range days. There is also a 5 wave structure so chasing a market is not good strategy.
LET'S LOOK AT A DAILY CHART OF THE S&P 500 TODAY

The move up into the last high was a complete leg or complete trend. The question becomes is the move down a counter trend or a trend? The price of the low is consistent with a counter trend down at 3/8th of the range up. Counter trends up (if the trend is down) in this index can take the form of a small double top. So clearly moving above the high of the 29th at 1205 would eliminate the standard form of a counter trend up for this index and give an indication the index was resuming the up trend. If the index goes lower there is a strong probability for a couple wide range days down. If the index breaks the 1178 level which is the level of the April 20th high, it would be a significant sign of weakness. The next three days should tell the story.
CRUDE OIL

The index came down to 3/8th of the range, the normal correction for a strong trend. It did so in three days, the normal time period for a counter trend in a fast market. If the trend is going to resume a new high should be hit this week. If not there will be a lower high and likely a significant move down. Because of the form of the trend, the next high can be an important high, can be the end of the up trend. A new high needs to extend and not exhaust as it did on April 4th or June 27th.
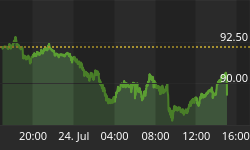
US$ (NO CHART)
The index did exceed 4 days, so the move down into the June 17 low was a counter trend move down. I see no reason why this is not a trend that will terminate August 5th at or close to 92 in the Dollar Index. That scenario would call for one more consolidation or counter trend an one more thrust up to complete on August 5th.
CNBC ASIA
LET'S LOOK AT THE HANG SENG DAILY CHART

Last week I indicated I had a series of cycles that could stop the advance. They were 90 days from low and 180 days from high. These cycles do not stand on their own but represents a probability. Remember, there is also the important factor of a possible False Break Pattern, which would indicate a top. The index has broke to a new high, tested that high on the 24th and failed to move higher and is now testing that price level. I still cannot make the call if this is a valid new leg up out of this consolidation. The move up is a complete wave structure, the question is the extent of this move down. The probabilities from price action make a breakout a good probability, I just need to see the index move past the time cycle that expired last week. If it starts to trade below the high of June 13th or 14,100 it could indicate a false break pattern and possible top. I need a few more days trading before I can confirm either scenario.
To all the technical analysts out there, notice how the trend in the Hang Seng, since the May low, is the same "Pattern of Trend" as the S&P 500 Index.
LET'S LOOK AT THE ASX 200 INDEX

I had a forecast that called for the index to go from the 45th day (which was the top so far) down into the 60th day with a congestion or counter trend of some sort. Today is the 60th day and the index has gone down 5 days and a ¼ retracement. That does hold the fast up trend intact. The index has rallied two days and has fallen two days and is still well above the low for the two day rally and each of those rally days moved well back into the previous days range and that is bullish. So the move down has been a struggled to go down for two days. The third day is usually critical and if that holds it will go a long way calling this Monday as a low. The only problem with this cycle is we must be sure it is not a counter trend high. I don't believe that is the case. It will be proven to be a low if the index can move higher past Tuesday. If this is a leg up, the minimum would take it to 4400.


