


5/12/2014 9:00:52 AM
Bulls and bears await a catalyst...
Recommendation: Take no action.
Click here to access our stock market chat rooms today! For a limited time, try our chat room for free. No subscription necessary to give it a try.
Stock Market Trends:

- ETF Positions indicated as Green are Long ETF positions and those indicated as Red are short positions.
- The State of the stock market is used to determine how you should trade. A trending market can ignore support and resistance levels and maintain its direction longer than most traders think it will.
- The BIAS is used to determine how aggressive or defensive you should be with an ETF position. If the BIAS is Bullish but the stock market is in a Trading state, you might enter a short trade to take advantage of a reversal off of resistance. The BIAS tells you to exit that ETF trade on "weaker" signals than you might otherwise trade on as the stock market is predisposed to move in the direction of BIAS.
- At Risk is generally neutral represented by "-". When it is "Bullish" or "Bearish" it warns of a potential change in the BIAS.
- The Moving Averages are noted as they are important signposts used by the Chartists community in determining the relative health of the markets.
Best ETFs to buy now (current positions):
Long DIA at $161.48 as of December 19, 2013
Long QQQ at $85.99 as of December 19, 2013
Long SPY at $181.19 as of December 19, 2013
Click here to learn more about my services and for our ETF Trend Trading.
Value Portfolio:
Long SDRL at $33.90 on June 15, 2012 (Shares were put to us when options expired. We were paid $1.10 per share when we sold those options and bought shares for $35.00 each). We have collected dividends: March 5, 2014 $0.98, December 3, 2013 $0.95, September 5, 2013 $0.91, June 5, 2013 $0.88, $1.70 Dec 4, 2012, $0.84 Sep 4, 2012. Total = $5.28 in dividend payments.
Short FXE at $124.19 on August 24, 2012
Long UUP at $22.43 on August 24, 2012
Short FXE at $134.48 on October 4, 2013
Long SDRL at $35.43 on Feb 18, 2014
Long SDRL at $33.50 on March 21, 2014 (Shares were put to us when options expired. We were paid $1.50 per share when we sold those options and bought the shares for $35.00 each.
We publish new reports to our free newsletter every month. If you're not a member, sign up by clicking here: Free Stock Market Newsletter
Equities opened relatively flat again and immediately dove for the first fifteen minutes. From there, a move higher for a half hour was followed by more selling and a double bottom was formed by late morning. From there, the bulls ran prices higher the rest of the morning and through the lunch hour then the bears counterattacked to form a higher low before the bulls took prices higher with an hour and a half remaining. The move lasted into the close allowing all three major indexes to record fractional, albeit somewhat modest, gains. This left the NASDAQ-100 even with its 20-Day Moving Average (DMA) but still below its 50-DMA. The Dow and S&P-500 remain above their respective 20-, 50-, and 200-DMAs. The NASDSAQ-100 and the S&P-500 remain in trading states while the Dow is in an uptrend state. The Semiconductor Index (SOX 575.96 -1.87) closed with a modest loss. The Dow Jones Transports (IYT 138.17 +0.30) posted a modest gain and did the Russell-2000 (IWM 110.03 +1.00) added most of one percent. The Bank Index (KBE 31.72 +0.06) and the Regional Bank Index (KRE 38.22 +0.33) both added fractional gains while the Finance Sector ETF (XLF 21.93 -0.01) closed flat. All equity indexes that we regularly monitor are now in trading states with the noted exception of the Dow, which is in an uptrend state and the Russell-2000, which is in a downtrend state. Longer Term Bonds (TLT 111.24 -0.36) slipped fractionally as it has been held at its 400DMA for seven consecutive sessions. TLT is in a trading state and closed on its 20-DMA but remains above its 50- and 200-DMAs. Trading volume was light with 637M shares traded on the NYSE. Trading volume on the NASDAQ was average with 1.957B shares traded.
There were two economic reports of interest released:
- Wholesale Inventories (Mar) rose +1.1% versus an expected +1.0% rise
- JOLT Job Openings (Mar) came in at 4.014M versus February's 4.125M
Both reports were released a half hour into the session.
For eleven sessions in a row, the NASDAQ has had more new lows than new highs. So, even when the NASDAQ shows gains and otherwise shows bullish market internals, the number of new lows continues to be greater than the number of new highs. This is clearly a sign of weakness but may also be a contrarian indicator. The last time there were ten or more consecutive sessions where the NASDAQ had more new lows than new highs was in November 2012 which corresponds with the last time that the NASDAQ-100 was trading below its 200-DMA and the last significant bottom for equities. The NASDAQ-100 struggled the entire month of December before starting a grinding move higher that lasted the entire year of 2013.
We are watching gold for a potential reversal in the Gold Miners Index (GDX 23.73 -0.01) closed flat. The price of Gold (GLD 124.10 -0.07) also closed relatively flat. Both indexes closed below their respective 20, 50-, and 200-DMAs.
Apple (AAPL 585.54 -2.45) slipped modestly. AAPL constitutes about 20 percent of the NASDAQ-100 and nearly five percent of the S&P-500.
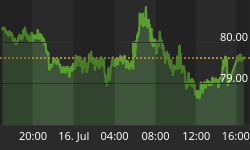
Seadrill Limited (SDRL 35.01 -0.96) lost more than two percent pulling back to a point still above the support of its 20- and 50-DMAs. We sold March 2014 $35.00 put contracts for $150 at the open on Feb 18th and bought shares at $35.43. The stock is now trading ex-dividend for $0.98. The shares were put to us at $35.00 less the $1.50 per share we were paid for the puts, so we have an effective price of $33.50.
The U.S. rose two tenths of one percent while the Euro slipped one half of one percent.
The yield for the 10-year treasuries rose two basis points to close at 2.62. The price of a barrel of crude oil fell twenty-seven cents to close at $99.99.
The implied volatility for the S&P-500 (VIX 12.92 -0.51) slipped more than three percent remaining well below its 200-DMA. The implied volatility for the NASDAQ-100 (VXN 16.52 -0.90) slipped five percent but remains just above its 200-DMA.
Market internals were mixed with advancers leading decliners 4:3 on the NYSE and by 9:5 on the NASDAQ. Down volume led up volume 5:4 on the NYSE while up volume led down volume nearly 2:1 on the NASDAQ. The index put/call ratio fell -0.15 to close at 0.77. The equity put/call ratio rose +0.06 to close at 0.72.
Conclusion/Commentary
Friday was a day where only small moves were made for equity indexes with the only larger moves made by the Russell-2000 and the Regional Bank Indexes, both up most of one percent. While this does not ensure the bulls will get behind the Dow's new all-time closing high recorded on Friday, it does suggest that the bears have lost the power to determine market direction in the near term. We are staying long until this plays out.
We hope you have enjoyed this edition of the McMillan portfolio. You may send comments to mark@stockbarometer.com.


