


5/18/2014 11:21:16 AM
Market Summary
Investors are continuing to 'buy the dips' as they have been for the past few months which contributes to the current range-bound trading environment. Most of the major equity indexes basically finished the week flat, even though the DJIA and S&P500 managed to hit intraday all-time highs earlier in week. The recent pattern has been investors cashing out gains at high prices, pushing prices down as shorts pile on; then buyers step in to buy the dips, pushing prices higher with a 'short squeeze'. The smaller capitalization indexes are lagging the broader market as exhibited by the Russell 2000 being stuck below its 200-day SMA, a sign of weak momentum. Investors are concerned about weakness in small caps, biotech and technology sectors being a precursor to overall market losses.
Our May 11th Weekly Setup mentioned "The current bull market is on pace to becoming the fifth longest ever. As long at the current market doesn't crash before this upcoming Memorial Day, the fourth place market to beat is the one that drove stocks higher between 2002 and 2007. The big daddy is the 1987 to 2000 bull market; the current market would have to continue until at least 2021 to threaten the longest bull market. defensive sectors are leading the charge. It's this rotation to 'risk-off' stocks that we interpret to mean upside potential is limited over the next few months." Taking a gander at the updated year-to-date performance graph below, what is clear is that investors are seeking yield. Note the highest performing sectors are utilities, treasury bonds, and real estate which all provides high yields compared to all the other sectors. Investors are pouring money into U.S. Treasury bonds, considered the world's safest asset and they're loading up on dull, but reliable utility stocks. They are playing it safe by dumping holdings that would get hurt most from a stalled recovery, like stocks of retailers and risky small companies. This clearly confirms investors are nervous about the economy and eschewing high growth stocks in favor of capital preservation. The sector rotation continues from the riskier high-growth and momentum names to conservative high-yielding shares. Pimco's Bill Gross called this new secular investment theme "the new neutral". Gross expects slow economic growth and low real interest rates over the next five years, and this will fuel the hunt for yield. Click here to get the previous article http://www.stockbarometer.com/viewarticle.aspx?articleid=10445

Market Outlook
Another tool that we use to help confirm the overall market trend is the Momentum Factor ETF (MTUM) chart. Momentum Factor ETF is an investment that seeks to track the investment results of an index composed of U.S. large- and mid-capitalization stocks exhibiting relatively higher price momentum. The fund generally invests at least 90% of its assets in the securities of the underlying index or in depositary receipts representing securities in its underlying index. The MSCI USA Momentum Index consists of stocks exhibiting relatively higher momentum characteristics than the traditional market capitalization-weighted parent index, the MSCI USA Index, which includes U.S. large- and mid-capitalization stocks. This type of momentum fund is considered a reliable proxy for the general stock market trend. The chart below confirms our analysis indicating large capitalization stocks are in a neutral trend.

You can also monitor the Financials sector to get a feel for where the market is going. The Financial Select Sector ETF (XLF) is an investment that seeks results that, before expenses, correspond to the price and yield performance of publicly traded equity securities of companies in the Financial Select Sector Index. In seeking to track the performance of the index, the fund employs a replication strategy. It generally invests substantially all, but at least 95%, of its total assets in the securities comprising the index. The index includes companies from the following industries: diversified financial services; insurance; commercial banks; capital markets; REITs; consumer finance; thrifts & mortgage finance; and real estate management & development. The fund is non-diversified. It is generally assumed that any bullish leg usually includes financial sector participation, and it is hard for the overall market to move higher without financials. The sluggish economy and low interest rates adversely impact financial stocks which benefit from higher interest rates. As denoted in the chart below, the financial sector index has been trading laterally the past few months along with the overall stock market.

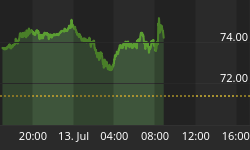
The updated VIX graph below continues to show investors are not concerned about market risk as the VIX stays near its lowest level.

In the updated AAII Sentiment Survey below, individual investors have gotten a little more bullish this past week but they are still overwhelmingly anticipating the market to remain neutral. As a contrarian sign, the bearish percentage is extremely low which suggest continued downside volatility because when stocks pull back; investors are caught off guard and rush in to close positions.

The previous analysis of the National Association of Active Investment Managers survey is still valid "NAAIM member exposure average is approx. 75% which is a moderately bullish level, but significantly lower than the ready reading from a few weeks ago.Risk has clearly increased in the market recently due to worries over the emerging markets. As a result, NAAIM's active risk managers adjusted their overall exposure accordingly."

Trading Strategy
Our May 11th Weekly Setup opined "Selling in May and going away is not really a trading methodology. it should be viewed as more of a risk management strategy.compared to other times of year, the next few months offer the highest probability the overall stock market will being in negative territory.Since the market crash, May has been the lousiest month for the S&P index. It would probably be a bad move to literally cash out of your stock portfolio in May and buy back in later in the year .you need to carefully manage long positions with tight stops and size limits. if you have losing positions now might be a good time take the loss and reposition those funds in more profitable shares. Holding cash is a viable strategy and smart decision compared to trading for the sake of trading in a risky environment."
We also said "investors' concern about the overall economy and whether the highflying momentum stocks in the Nasdaq 100 and Russell 2000 are overvalued compared to projected future economic growth... it is considered a relatively unique situation where DJIA and S&P 500 are outperforming both NASDAQ and Russell 2000. In 43 years since 1971, DJIA and S&P 500 have bettered NASDAQ and Russell 2000 just eleven times (Russell 2000 eight times since 1979) over the course of the full year. Seven of those eleven years were flat to downright ugly. Only 1975, 1986, 1989 and 1997 were above average years." Click here to get the previous article http://www.stockbarometer.com/viewarticle.aspx?articleid=10445
In recent articles we discussed our forecast for stocks prices to nudge toward new highs and then drop back down to a support level in a trading range. As earnings season is winding down, the stock market avoided a broad-based selloff which is consistent with our expectation for continued range-bound trading. Looking under the hood of recent market action we can see sector rotation going on. It appears investors are stepping up to the plate and scooping up some of the high-flying stocks that have dropped in price. While it is still relatively risky to trade a lot of the 'high momentum' stocks, if there are shares you really like, it might be worth the risk to buy in if you are prepared to ride out future volatility. Any bullish trades need to be hedged for downside protection as the current bull market is getting tired and traders have become quicker on the trigger with bidding down prices. Market neutral portfolio positioning is currently the best trading strategy to take advantage of prices vacillating between recent highs and support levels.
As we have wrote about recently, riskier stocks that comprise the Nasdaq 100 index (NDX) had been in a confirmed downtrend compared to the large capitalization DJIA and S&P500 indexes. The updated chart below indicates technology stocks are bouncing off a bottom and its shares are trending with the large caps. This is further support for our comment above suggesting it is getting a little less risky to do bullish Nasdaq trades.

Similar to our analysis of the Nasdaq 100 index above, the small capitalization Russell 2000 (RUT) index is also in a downtrend compared to the large capitalization indexes. However, you can easily see the difference between the Nasdaq chart above and RUT below is the small cap index has not yet signaled a bottom and continues trending down. At this point, trading small capitalization stocks is more risky compared to the other major indexes.

Some of the biotechnology stocks are considered high momentum 'hi mo' shares that had been leading the bull market higher. As evidenced in the Biotechnology index (IBB) chart below, these stocks started crashing and went into a serious correction in February. As highlighted in the chart, biotech's appear to have found a support level and for the last month or so have traded range-bound. These stocks were on the 'no fly list' as they were crashing, but now are less risky for market neutral trades and/or buying undervalued shares for a long term bet.

We talked about how "There was a perception that the FMOC winding down its QE programs should presage higher Treasury bond rates. That has not happened yet as treasuries continue climbing higher from the end-of-last-year lows." It is easy to see to see the continuing uptrend in the daily Treasury bond chart below.

Treasury bonds are flashing overbought signals in the daily chart above. Looking at the longer term charts will provide clues on the strength of a trend. You can see in the weekly chart below the Treasury bond bullish trend is strong without a defined resistance level. The chart below suggests long Treasury bond trades are less risky than short positions; this is especially true if equities wane and investors move to safe-haven assets.

The trading axiom "the trend is your friend" is the way to play this market, as we said recently "As the stock prices have stabilized we expect it will be easier to manage risks and more trade opportunities should be available."
Regards,


