


Forex Trading Alert originally published on May 20, 2014, 10:20 AM
Earlier today, the minutes of the RBA's May policy meeting showed that the bank plans to hold interest rates at record lows for an extended period of time. Additionally, the Conference Board reported that its index for Australia was flat in March, after a 0.2% rise in February. In reaction to this disappointing news, the Australian dollar dropped to a 2-week low against its U.S. counterpart, declining below two important support levels. Does this mean that investors' sentiment is deteriorating and we'll see AUD/USD lower?
In our opinion, the following forex trading positions are justified - summary:
EUR/USD: short (stop-loss order: 1.4040)
GBP/USD: none
USD/JPY: none
USD/CAD: none
USD/CHF: none
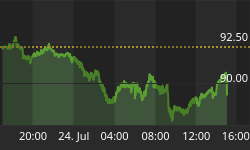
AUD/USD: short (stop-loss order: 0.9410)
EUR/USD

From this perspective, we see that although EUR/USD moved higher yesterday, the pair still remains in the consolidation range below both previously-broken major resistance lines: the long-term declining line and the lower border of the rising trend channel. Therefore, what we wrote on Friday is still up-to-date:
(...) as long as there is no invalidation of the breakdown under these lines, further deterioration is likely. If this is the case, and the exchange rate extends losses in the coming week (or weeks), the downside target will be around 1.3516 (where the 38.2% Fibonacci retracement based on the entire March 2013-May 2014 is) or even slightly lower - around 1.3480, where the bottom of the previous bigger correction (between Dec. and Feb.) is .
Having discussed the above, let's focus on the short-term perspective.

Looking at the daily chart, we see that although the very short-term situation has deteriorated slightly, EUR/USD still remains in a consolidation between Thursday's high and low. In our opinion, as long as the exchange rate is trading above the 200-day moving average another attempt to move higher can't be ruled out - especially when we factor in buy signals generate by the CCI and Stochastic Oscillator. If this is the case, and EUR/USD climbs, we may see an upward move to a resistance zone created by last week's high, the 38.2% Fibonacci retracement based on the entire recent decline and the 50-day moving average (around 1.3770-1.3785). However, if the pair extends losses and drops below the 200-day moving average, the next downside target will be the upper line of the declining trend channel (currently around 1.3640).
Before we summarize this currency pair, we would like to draw your attention to the quote from our last Forex Trading Alert:
(...) In our opinion, the breakout in the USD Index above the medium-term resistance line can trigger a significant rally soon - even without the above-mentioned correction. Therefore, we remain bearish on EUR/USD.
Very short-term outlook: bearish
Short-term outlook: bearish
MT outlook: bearish
LT outlook: bearish
Trading position (short-term): Short. Stop-loss order: 1.4040. The short position featured on May 8th when EUR/USD was still above the 50-day moving average (blue line in the chart) remains profitable. We will keep you informed should anything change, or should we see a confirmation/invalidation of the above.
USD/CAD
From the medium-term perspective, the overall situation hasn't changed much as USD/CAD remains in a consolidation between 1.0813 and 1.0987 (the high and low that we saw at the turn of April and May). Today we'll focus only on the short-term picture.

Looking at the above chart, we see that the very short-term situation has improved slightly as USD/CAD bounced off two strong supports - the medium-term green line and the 2010 high. Although this is a bullish signal, we think that as long as the exchange rate remains in a consolidation, another sizable upward move is not likely to be seen. In our opinion, only if the pair breaks above the upper line of the formation, we will see an increase to around 1.1014 (where the size of the upswing after a breakout will correspond to the height of the consolidation) or even to around 1.1043, where the 50% Fibonacci retracement (based on the entire recent decline) meets the Apr.25 high. Finishing our commentary on this currency pair, please note that the CCI and Stochastic Oscillator generated buy signals, while the RSI bounced the level of 30, which supports the bullish case, suggesting that further improvement is just around the corner.
Very short-term outlook: mixed with bullish bias
Short-term outlook: mixed with bullish bias
MT outlook: bullish
LT outlook: bearish
Trading position (short-term): In our opinion no positions are justified from the risk/reward perspective as the space for further declines may be limited. We will keep you informed should anything change, or should we see a confirmation/invalidation of the above.
AUD/USD

In our previous Forex Trading Alert, we wrote the following:
(...) we remain convinced that as long as there is no breakout above the nearest resistance level or breakdown below the major support, another sizable move is not likely to be seen.
As you see on the above chart, the situation in the medium term has deteriorated as AUD/USD declined below the thin green support line, approaching the lower border of the consolidation range. If the exchange range extends declines and drops below this line (at 0.9253), we will see further deterioration and the downside target will be the medium-term bold green line (currently around 0.9036). In our opinion, this scenario is more likely than not as sell signals generated by the indicators remain in place, supporting the bearish case.
Let's check the short-term picture.

Quoting our Forex Trading Alert posted on Friday:
(...) In our opinion, there are a number of signs that a pullback in AUD/USD is close. First, the exchange rate reached the next resistance zone created by the 76.4% and 78.6% Fibonacci retracement levels (based on the entire recent decline). From our experience, this area usually stops (or at least decelerates) further improvement. Secondly, when we take a closer look at the daily chart, we notice a 5-wave sequence, which suggests that the correction is likely to be seen. Another negative signs come from the indicators. (...) which increases the risk of trend reversal.
(...) all the above-mentioned bearish factors remain in place, which suggests that it may take some time before a breakout higher becomes likely. Therefore, we remain convinced that further deterioration is just around the corner (...)
Yesterday, we added the following:
(...) we believe that if the pair declines below the lower border of the consolidation (which corresponds to the medium-term green support line at the moment), the current correction will accelerate and we'll see a drop to at least 0.9272 (where the 23.6% Fibonacci retracement based on the entire Ja.-Apr. rally is).
As you see on the above chart, we noticed such price action earlier today. AUD/USD not only declined below the green support line and the lower border of the consolidation, but also slipped below its downside target. In our opinion, this is a bearish signal and if the exchange rate breaks below the May 5 low of 0.9251, we'll see a test of the strength of the rising green support line based on the Jan. lows (currently around 0.9234). If it is broken, we think that the next downside target will be the May low of 0.9200.
Very short-term outlook: bearish
Short-term outlook: bearish
MT outlook: bearish
LT outlook: bearish
Trading position (short-term): Short. Stop-loss order: 0.9410.
Thank you.


