


5/28/2014 9:32:26 AM
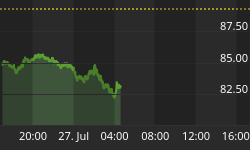
S&P-500 hits a new all time high...
Recommendation: Take no action.
Click here to access our stock market chat rooms today! For a limited time, try our chat room for free. No subscription necessary to give it a try.
Stock Market Trends:

- ETF Positions indicated as Green are Long ETF positions and those indicated as Red are short positions.
- The State of the stock market is used to determine how you should trade. A trending market can ignore support and resistance levels and maintain its direction longer than most traders think it will.
- The BIAS is used to determine how aggressive or defensive you should be with an ETF position. If the BIAS is Bullish but the stock market is in a Trading state, you might enter a short trade to take advantage of a reversal off of resistance. The BIAS tells you to exit that ETF trade on "weaker" signals than you might otherwise trade on as the stock market is predisposed to move in the direction of BIAS.
- At Risk is generally neutral represented by "-". When it is "Bullish" or "Bearish" it warns of a potential change in the BIAS.
- The Moving Averages are noted as they are important signposts used by the Chartists community in determining the relative health of the markets.
Best ETFs to buy now (current positions):
Long DIA at $161.48 as of December 19, 2013
Long QQQ at $85.99 as of December 19, 2013
Long SPY at $181.19 as of December 19, 2013
Click here to learn more about my services and for our ETF Trend Trading.
Value Portfolio:
Long SDRL at $33.90 on June 15, 2012 (Shares were put to us when options expired. We were paid $1.10 per share when we sold those options and bought shares for $35.00 each). We have collected dividends: March 5, 2014 $0.98, December 3, 2013 $0.95, September 5, 2013 $0.91, June 5, 2013 $0.88, $1.70 Dec 4, 2012, $0.84 Sep 4, 2012. Total = $5.28 in dividend payments.
Short FXE at $124.19 on August 24, 2012
Long UUP at $22.43 on August 24, 2012
Short FXE at $134.48 on October 4, 2013
Long SDRL at $35.43 on Feb 18, 2014
Long SDRL at $33.50 on March 21, 2014 (Shares were put to us when options expired. We were paid $1.50 per share when we sold those options and bought the shares for $35.00 each.
We publish new reports to our free newsletter every month. If you're not a member, sign up by clicking here: Free Stock Market Newsletter
Equities saw a gap up open followed by more buying. The Dow closed with a fractional gain and just under its all time high in a trading state. The S&P-500 closed at a new all time high and joined the NASDAQ-100 in an uptrend state. The NASDAQ added more than one percent to lead equity indexes higher as it finished at its high of the day. All three are above their 20-, 50-, and 200-Day Moving Averages (DMAs) with the NASDAQ-100 continuing to show relative strength over the others. The Dow Jones Transports (IYT 143.68 +0.59) posted a fractional gain and the Semiconductor Index (SOX 597.08 +7.17) added more than one percent. Both closed above their respective 20-, 50-, and 200-DMAs. The Russell-2000 (IWM 113.58 +1.61) joined the other leading indexes in closing above its 20-, 50-, and 200-DMAs and also is in an uptrend state. The Bank Index (KBE 31.98 +0.22) posted a fractional gain but closed just below its 200-DMA while the Regional Bank Index (KRE 38.60 +0.46) added more than one percent and closed above its 200-DMA. Both closed above their 20-DMAs. The Finance Sector ETF (XLF 22.23 +0.19) rose most of one percent and sits above its 20-, 50- and 200-DMAs. Longer Term Bonds (TLT 113.36 +0.66) posted a fractional gain to close above its 20-, 50- and 200-DMAs. It maintains a trading state. Trading volume strengthened but remained somewhat light with 658M shares traded on the NYSE. Trading volume on the NASDAQ was also below average with 1.798B shares traded.
There were five economic reports of interest released:
- Durable Goods Orders (Apr) rose +0.8% versus an expected -1.3% fall
- Durable Orders ex-transportation (Apr) rose +0.1% versus an expected -0.2% fall
- Case-Shiller 20-City Index (Mar) rose 12.4% versus an expected +11.8% rise
- FHFA Housing Price Index (Mar) rose +0.7% versus February's +0.6% rise
- Consumer Confidence (May) came in at 83.0 versus an expected 82.7
The first four reports were released a half hour or more before the open. The last report was released a half hour into the session.
We are watching gold for a potential reversal in the Gold Miners Index (GDX 22.41 -0.90) plummeted four percent as the price of Gold (GLD 121.85 -2.66) slipped two percent. Both closed below their 20-, 50-, and 200-DMAs.
Apple (AAPL 625.63 +11.50) added nearly two percent. AAPL constitutes about 20 percent of the NASDAQ-100 and nearly five percent of the S&P-500.
Seadrill Limited (SDRL 37.56 +1.19) added most of three percent and appears to be ready to take a breather soon as it is overbought. It is in an uptrend state. We sold March 2014 $35.00 put contracts for $150 at the open on Feb 18th and bought shares at $35.43. The stock is now trading ex-dividend for $0.98. The shares were put to us at $35.00 less the $1.50 per share we were paid for the puts, so we have an effective price of $33.50.
The U.S. dollar was little changed as was the Euro.
The yield for the 10-year treasuries fell two basis points to close at 2.54. The price of a barrel of crude oil fell twenty-four cents to close at $104.11.
The implied volatility for the S&P-500 (VIX 11.51 +0.15) rose one percent and hovers near recent lows. The implied volatility for the NASDAQ-100 (VXN 13.72 +0.17) rose one percent as well but remains well below its 200-DMA.
Market internals were bullish with advancers leading decliners 2:1 on the NYSE and by 3:1 on the NASDAQ. Up volume led down volume 2:1 on the NYSE and by 4:1 on the NASDAQ. The index put/call ratio rose +0.34 to close at 0.99. The equity put/call ratio fell -0.05 to close at 0.53.
Conclusion/Commentary
Tuesday was the first trading day after the market was closed for the Memorial Day holiday on Monday, May 26th. Leadership of the leading indexes is apparent with three of the four rising more than one percent on Tuesday as the S&P-500 achieved a new all-time closing high and the Dow closed just under its respective all-time high. The Regional Bank Index and the Bank Index both dutifully pierced up through their respective 200-DMAs early in the session then gave back some of those gains with the Regional Index able to close above its 200-DMA but the Bank Index fell short. Still, with all the leading indexes all in uptrend states and joined by the S&P-500, equities are looking fairly bullish. With that said, most equity indexes are overbought here and longer term bond prices continue to move higher. This makes us nervous and we think it is likely that equity prices take a rest here, for at least a session or two. There is still plenty of short interest on the bank indexes and the Russell-2000 so a further move higher will likely result in a short squeeze that will drive prices more dramatically higher once the overbought conditions are worked off. We will maintain our long positions for now.
We hope you have enjoyed this edition of the McMillan portfolio. You may send comments to mark@stockbarometer.com.


