


6/1/2014 6:00:34 PM
Market Summary
A late Friday surge pushed the DOW Jones Industrial Average and S&P500 to close out the month of May at all-time highs. May was the best month for the stock market since February. The S&P 500 rose 2.1% for the month while the DOW gained .8% and the Nasdaq climbed 3.1%. The market trend is converting from neutral to moderately bullish.
We recently said "investors fear has diminished to very low level, they have developed an appetite for risk.investors are moving out of the higher yielding utilities and Treasury bond sectors back into the high growth stocks like financials and technology." You can call off the technology sector correction. In the beginning of March the tech-heavy Nasdaq 100 index dropped 7.50% over the next five weeks, but the indexe's performance has actually caught up with the overall stock market. Including dividends, both the Nasdaq and general market are up approximately 4.3% on the year. Previous Weekly Setup articles recommended identifying technology stocks you liked and bidding on shares that had dropped in price. Tech stocks such as Facebook (FB) and Apple, Inc. (AAPL) are up substantially year-to-date, but shares of Twitter (TWTR) and Groupon (GRPN) are in bear market territory losing half their value.
Recent Weekly Setup articles mentioned "The current bull market is on pace to becoming the fifth longest ever. As long at the current market doesn't crash before this upcoming Memorial Day. Note the highest performing sectors are utilities, treasury bonds, and real estate which all provides high yields compared to all the other sectors..." The current bull market is officially the fifth longest on record. The graph below displays performance results over the past 30 trading days. After dragging stocks down in March and early April, the technology sector is now leading the market higher. Treasury bonds and real estate continue performing well as they have all year in a low interest rate environment.

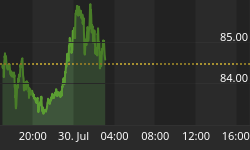
Treasury yields remain near their lows for the year at 2.47%. Bond prices generally move opposite of yields as strong demand from foreign and domestic buyers is keeping bonds near their highs for the year. The current low interest rates are believed to signal economic weakness with low inflation. The chart below illustrates this phenomenon as low inflation expectations have sent gold prices crashing while treasury bonds move higher.

Market Outlook
Our previous comments about market action around Memorial Day ".According to the Stock Trader's Almanac the days after Memorial Day have been rather bullish. May was the best month from 1985 to 1997, some of this bullishness after Memorial Day can be attributed to the strength of the first two days of June.volume is often diminished and trading uninspired." Last week was what some analysts refer to as a "thin to win" market rally because prices moved higher due to thin volume.Memorial Day officially kicked off the summer and this week's volumes proved that point with the Dow seeing the lightest volume of the year.
The May 25th Weekly Update mentioned "The Momentum Factor index chart highlights a bullish price breakout. We have to see whether this is a confirmed move or a 'bull trap'." The updated chart below confirms the price breakout as the MTUM has catapulted above resistance and technical strength and momentum indicators signal a bullish trend. The 'bulls' are firmly in control as the bears are hibernating.

The CBOE Volatility index (VIX) fell to a new annual intraday low of 11.32 this week before closing at 11.40. As we have been saying recently "The current level is extremely low by historical standards and suggests investors are very complacent and are not concerned about market volatility. The low level of complacency is worrisome to some market watchers, and it most likely indicates stock prices will remain stable."

Last week we said "The updated surveys shows individual investors are still predominantly neutral. What is interesting is even though the overall market went higher last week; individual investors are less bullish and more bearish. From a contrarian perspective this means stock prices should be expected to continue climbing higher as most individual investors are usually behind the curve following market." right on queue the major indexes reached all-time highs and the updated survey results below show retail investors jumping on board with increased bullishness. Expect the overall stock market to fluctuate between the current highs as resistance and moderate moves lower on lighter than normal volume as the markets settles into summer doldrums.

The previous analysis of the National Association of Active Investment Managers said "investment managers have gotten even less bullish over the past week.Last quarter the NAAIM Exposure Index reading averaged 84.40%, the current measure has sank all the way down to 67.23%. Professional money managers clearly are getting nervous about the market outlook, but if stocks keep moving higher investors might scramble to get back in, sending prices even higher." The current reading is moderately higher 70.94% but is still relatively low which supports our contention that trading should remain subdued in the near term.

Trading Strategy
While few people think stocks will go up indefinitely, there is a growing consensus that we're in a new normal and part of that is extended long-term rallies. Everyone has their own interpretation but two points are indisputable 1) historically low rates and 2) the Fed is still providing liquidity through its bond buying programs. We live in an environment of stocks are the best game in town and big money knows it. According to the Stock Trader's Almanac "June is the end of the Best Eight Months of the Year for Nasdaq and the Russell 2000 small cap index... we will not be selling and going away. sell any underperforming open long positions and further tighten stops on winners, but we will not be selling everything, nor going away."
Market analysts point out that Nasdaq stocks over the last 43 years rank seventh with a 0.7% average gain, up 24 of 43 years. This contributes to Nasdaq's 'best eight months' which ends in June. June ranks near the bottom on the Dow Jones Industrials just above September since 1950 with an average loss of 0.3%. S&P 500 performs similarly poorly, ranking tenth, but essentially flat (-0.03% average). Small caps also tend to fare well in June. Russell 2000 has averaged 0.4% in the month since 1979. In midterm years since 1950, June ranks dead last for DJIA (-1.9%) and S&P 500 (-2.1%). S&P 500 has fallen in 11 of the last 16 midterm Junes. Nasdaq and Russell 2000 struggle in midterm years as well with June's ranking slipping to tenth for both and average performance turning solidly negative, -2.1% and -2.5% respectively.
Last week's Market Update article said "Trading volume is normally below normal during the week of the Memorial holiday as the market will be closed on Monday and traders return from vacation. The summer months are typically slow with little going on to shake the market from its current course.It appears investors are stepping up to the plate and scooping up some of the high-flying stocks that have dropped in price. While it is still relatively risky to trade a lot of the 'high momentum' stocks, if there are shares you really like, it might be worth the risk to buy in if you are prepared to ride out future volatility. Technology stocks are bouncing off a bottom and its shares are trending with the large caps. This is further support for our comment above suggesting it is getting a little less risky to do bullish Nasdaq trades."
As discussed above, both the DOW and S&P5 500 closed at the week at record highs. The updated chart below show how the Nasdaq has recovered and is trending with the large cap indexes. The Nasdaq moved up so rapidly that at this point you need to be cautious when about entering long positions on tech stocks. In March, investors sold off Nasdaq stocks they thought were at frothy levels and if these shares keep rising they may be overbought again, plus some of the technology names are still lagging.

Low market volatility and a sagging Russell 2000 have been cause of concern recently. The decline in volatility is reminiscent of the latter stages of the last bull market that ended in 2007 and small-cap stocks are generally considered more sensitive to local economic conditions. However, small-caps are actually behaving in a usual manner. In a typical year the smaller fry stay on the sidelines while the big boys run the show. Then, around late November, small stocks begin to wake up and in mid-December, make their move. Anticipated year-end dividends, payouts and bonuses could be a factor. Other major moves are quite evident just before Labor Day-possibly because individual investors are back from vacations-and off the low levels from late October. Small-caps outpaced large-caps during the entire second half of 2013 and strength continued until the beginning of March when stocks prices pulled back. From mid-December till now, small-caps have been following their typical seasonal pattern.
Last week the Market Update opined "last week the Russell 2000 index beat the other major indexes gaining 1.1% for the week. You still need to wait on confirmation the small cap index has found a support level after technically correcting the previous 6 weeks, or whether this a 'bull trap' where A false signal indicating that a declining trend in a stock or index has reversed and is heading upwards when, in fact, the security will continue to decline." The update chart below indicates the small cap Russell 2000 found a support level where the price is bouncing off of and there has not yet been a "bull trap". As discussed above, smaller cap stocks typically lay dormant during the summer and awaken in the fall. However, when second quarter earnings season begins in a month or so you may be able to get some quick gains from making bets on smaller cap stocks that are on your watch list.

Gold prices on Friday logged their lowest settlement in four months and suffered from their worst monthly decline this year as recent gains in equities lured investors away from the precious metal. "Gold has been trading in a compressing range since March with prices being supported by geopolitics, while the broad strength in stocks has kept pressure on precious metals," said market analyst Tyler Richey. "Going forward, inflation remains the key catalyst and although there are signs that inflation is bottoming (not only domestically but globally), it's not going to be enough to initiate a gold rally just yet." But the "cure for low prices is, low prices. Bulls will argue that the lack of bullish sentiment may serve as a contrarian signal and therefore prices could soon attract fresh buying interest," he said. As signaled in the chart below, gold is extremely oversold and trading down at a support level established at the end of February. The chart is also displaying a candlestick bullish reversal signal which if confirmed would suggest a low risk opportunity to generate quick gains with bullish bets on gold.

Our recent Market Update analysis is still valid "volatility is extremely low and the major indexes have been in a tight trading range with prices fluctuating between the top and bottom of the range. In the current environment, it is prudent to maintain tight stops with proper position sizing for long trades (whether bullish or bearish). As we have demonstrated in our trading newletters, spread trading works well in this market as the trades are less expensive and positions are protected if the trade goes against you. Generally, gains are limited when doing 'spreads', but this is not an issue in the current market where prices are basically moving sideways."
Regards,


