• 619 days Will The ECB Continue To Hike Rates?
  • 619 days Forbes: Aramco Remains Largest Company In The Middle East
  • 621 days Caltech Scientists Succesfully Beam Back Solar Power From Space
  • 1,021 days Could Crypto Overtake Traditional Investment?
  • 1,026 days Americans Still Quitting Jobs At Record Pace
  • 1,028 days FinTech Startups Tapping VC Money for ‘Immigrant Banking’
  • 1,031 days Is The Dollar Too Strong?
  • 1,031 days Big Tech Disappoints Investors on Earnings Calls
  • 1,032 days Fear And Celebration On Twitter as Musk Takes The Reins
  • 1,033 days China Is Quietly Trying To Distance Itself From Russia
  • 1,034 days Tech and Internet Giants’ Earnings In Focus After Netflix’s Stinker
  • 1,038 days Crypto Investors Won Big In 2021
  • 1,038 days The ‘Metaverse’ Economy Could be Worth $13 Trillion By 2030
  • 1,039 days Food Prices Are Skyrocketing As Putin’s War Persists
  • 1,041 days Pentagon Resignations Illustrate Our ‘Commercial’ Defense Dilemma
  • 1,042 days US Banks Shrug off Nearly $15 Billion In Russian Write-Offs
  • 1,045 days Cannabis Stocks in Holding Pattern Despite Positive Momentum
  • 1,046 days Is Musk A Bastion Of Free Speech Or Will His Absolutist Stance Backfire?
  • 1,046 days Two ETFs That Could Hedge Against Extreme Market Volatility
  • 1,048 days Are NFTs About To Take Over Gaming?
Lending: The Good, Bad, And Ugly

Lending: The Good, Bad, And Ugly

Aristotle said, “The most hated…

  1. Home
  2. Markets
  3. Other

Commodities Elliott Wave Analysis: GOLD and Crude OIL

Gold broke to the downside last week, out of triangle pattern that was placed in wave (b) so current leg down should be wave (c) as part of D of a big triangle from a daily chart. We know that wave (c) is impulsive wave so we need to be aware of a bullish reversal after a five wave drop from wave e) swing high. In the last few sessions market slowed down around 1240-1245 so it's probably wave iv)so decline could extend down to 1230 by the end of the week.

GOLD 4h Elliott Wave Analysis

GOLD 4-Hour Elliott Wave Analysis Chart

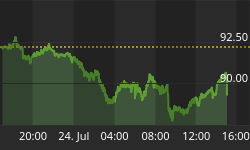
Crude oil has turned bearish last week, away from 104.00-104.50 resistance where we were looking for a wave (d) high. Notice that market turned nicely down, through the support channel line that confirms the bearish view for a three wave drop into wave (e) back to 100-101 area. Once those levels will be seen, we will turn bullish as big triangle since March could then be near completion.

OIL 4h Elliott Wave Analysis

OIL 4-Hour Elliott Wave Analysis Chart


Interested in our analysis? Get now 1 month of full service for just 1€. http://www.ew-forecast.com/service


Back to homepage

Leave a comment

Leave a comment