


The following is part of Pivotal Events that was published for our subscribers May 29, 2014.
Signs Of The Times
"Bond buyers jockeyed to get a piece of $1.6 billion of risky Fannie Mae securities enabling the company to twice-cut the yield."
- Wall Street Journal, May 21
"It's getting harder to trade bonds. Hours, sometimes days can go by before investors can complete a transaction. That's not dissuading them from piling into the most-illiquid debt out there. The 'roach motel' dynamic is as pernicious as ever."
- Bloomberg, May 21
"Stock-Picking Trumps Asset Allocation"
- Financial Post, May 27
"Current happenings in the U.S. Treasury market are a total head-scratcher."
- Chief Risk Officer, Wall Street, May 28
Credit Markets
Compulsive reaching for yield continues and one could say that in buying sub-prime mortgage bonds the Fed is "reaching for yield" as well. The latter is extremely reckless. While policymakers are on the "taper", they really can't stop buying.
Joy in credit markets is driving the senior stock indexes. All within a seasonally positive time of the year.
It is the old "tiger by the tail" story.
But despite all the "stimulus" and QEs, bond markets did suffer some hits that briefly overwhelmed the official buying programs. Another one seems at hand.
The above headlines record the compulsion, anecdotally.
The action in Europe has registered Downside Capitulations, the most recent being the Italian bond. The word bravissimo comes to mind.
It could be called an encore.
The Spanish bond set a low at 2.83% couple of weeks ago. The rebound made it to 3.09% last week and this week's low was 2.82%, which looks like a big test. It closed at 2.86%. The Italian bond is making similar moves.
The Greek bond could be leading, with a low of 5.85% set in early April. The high was 6.86% and the "test" low was at 6.19% on Monday. It is up a little since.
The Russian bond yield has been rising since the low of 6.46% set in the excitement of last May. The recent high was 9.63% set with Putin's bullying of Ukraine. The correction low was 8.60% set on Monday. Today it is at 8.65%.
With Russian yields rising for a year as most bonds were declining, Mister Market is in a very critical mode.
Over in junk-land, the price action continues.
JNK continues to set new highs as well as long run of the Weekly RSI being above 70. This week's reading is up to 76.
In 2011 it was above 70 for five months and the price dropped from 33.56 in June to 28.30 in October.
In 2012 the RSI was mostly above 70 from December to May. JNK dropped from 39.53 at the first of May to 36.19 in early July. On the Daily, the swing from overbought to oversold was outstanding. We called it a mini-panic.
There has not been a worthwhile correction since. Well, in March it declined from 40.96 to 40.60.
This has been a long run without a setback, the Weekly RSI has been essentially above 70 since early January, and leveraged positions have been more frequently mentioned than at this time last year.
Junk and Euro bond prices are vulnerable to trading excesses being accomplished at the prime time for change. The Russian yield is not partying and continues to rise.
Over in high-grade land, the bond future continues to rally. In January the chart pattern suggested a rally, with a gain of 8 percentage points being the most probable. The low was 123.25 and it is up 8.25% to 138.40.
Last week, we noted that the rise was not overbought. It is still not overbought. However, the surge in European buying into Wednesday was that today is Ascension Day, an important holiday. An interesting reason to buy bonds and an interesting play on words.
Stock Markets
The S&P has not recorded a meaningful correction since October 2011. That's 2.5 years without a correction amounting to 10 percent.
The NDX, which was the performance leader, accomplished what we considered as a cyclical peak in momentum in March. The decline was from 3838 to 3414 in April. We thought that a rebound to the 3625 level made sense and was vulnerable.
The global bond rally has driven to 3735, which is an impressive test of the high. The Daily RSI is getting approaching overbought.
Within this, the IBB (Biotechs) declined from 275 to 207, and has bounced to 240. A fifty-percent retracement. There is resistance at 245.
Small caps performed brilliantly with the RUT soaring to 1212 in March. The decline was to 1082 two weeks ago. The rebound has made it to 1144, which is a fifty percent retrace. This is also resistance at the 50-Day ma.
Behaviour of these two indexes seems appropriate for the end of a cyclical bull market. The rebound in the NDX must be due to a new set of favourites. The S&P and Dow are still fully engaged in complacency.
Banks (BKX) have been one of the weaker groups since the March high. That's despite outstanding action in all classes of bonds. But the direction in credit spreads has not been overly-friendly for most of the year.
Defining conditions continue to be the "Springboard Buy" of October, the topping action of stock leadership centred around March and that it is five years plus since the panic ended in 2009.
Does reckless central banking cause amnesia?
Commodities
In looking around, one can't help but be impressed by the resort to "oneness". In climate, there is only one cause of global warming and that is CO2 generated by evil industrial economies. CO2 released from soda pop, beer, Champagne and the lesser roses is not evil.
In policymaking there is only one tool to ward off the evil of a recession and that, since 1914, has been to depreciate the dollar. This intrusion will always prompt a business expansion and as Keyenes theorized currency depreciation will never cause "inflation". That, the Neo-Keyensians assure us is caused by "inflation expectations" of the untutored public.
For ancient commentators on commodities there is only one thing that drives prices up and that is the Fed with the evil notion that nothing good can happen without chronic depreciation.
Within this there are gold and silver bugs that are more selective in the "oneness" of the Fed.
The problem is that since the advent of modern central banking in 1694 there have been many inflations in financial assets, otherwise known as bull markets. There have been six great financial manias, otherwise known as bubbles.
Our era of inflation in financial assets began in 1980 as inflation in commodities, wages and the CPI blew out. In 1981 our presentation included that the world was changing and that "No matter how much the Fed prints, stocks will outperform commodities".
The Tech-Bubble of 2000 did not include much action in commodities and real estate so it was not a Classic Bubble like 1929 and 1720. The bubble that climaxed in 2007 was a "Classic".
Well, what about the big commodity rally into 2008. After 18 years of frustration commodity bulls decided that an 18-year bull was their due. Mother Nature would have had a rally with a Great Bubble. Added to this was the remarkable transformation in China and the ever-spurious notion of Peak Oil.
Typically in the long post-bubble contractions, the senior currency becomes chronically firm and most commodities become chronically weak. The comings and goings of the usual business cycle provide trading opportunities.
The DX set its low as the bubble began the severe part of its failure in 2008. The low was 71.30 and the high for the CRB was 474. Both levels have not been exceeded since. On the nearer-term, in November we looked for most commodities to bottom around December and rally to around March. This worked out and as each sector got overbought we advised taking money off the table. The last sector to get excited was agricultural commodities. The GKX rallied from 341 in January to 424 at the beginning of the month. This was the most overbought since the big high in 2011 and the rollover has been impressive.
At 388, there is support at 378. If that fails this sector will resume chronic weakness. Base metals (GYX) sharply rallied from 331 in November to 362 in January. The slump was to a new low at 321 in March, with the next high at 354 last week. There is resistance at the 362 level and it could prevail. There are still global problems with China's positions in copper and iron.
Crude oil reached our target of 105 and could not get beyond. It has been running out of seasonal support and an intermediate decline seems possible.
Overall, most commodities seem vulnerable to the possibility of a firming dollar and the discovery of concerns in credit markets. The next couple of months will tell the tale.
Precious Metals
The main play since October has been financial assets up and precious metal assets down. This is an extension of the phenomenon that became more evident beginning in September 2012. With every great financial bubble gold assets have been poor performers and then in the post-bubble contraction gold becomes the big performer.
On the big picture, the latter is the next big opportunity.
However, outside of the financial bubbles and their collapses the main driver on the decade-long bull market for the sector that completed in 2011 was the weakening dollar. It fell from 121 in 2001 to 72.70 in 2011.
That was the old recipe for a gold bull market and it ended in a climax of reckless dealings by the seniors. Accompanied by sensational action in silver relative to gold. The silver/gold ratio soared to an RSI of 92 and we noted that this indicated "dangerous" speculation, only seen at the blow-off in January 1980. We thought that the decline would not be a severe as post-1980.
The next speculative surge drove the silver/gold ratio to 84 in September 2012, which we noted as "dangerous".
The sector has been plagued by a somewhat firmer dollar, liquidation of inappropriate dealings by the seniors and the juniors running out of funding.
This is getting rid of the "old" paradigm and setting up for the "new" paradigm of the gold industry doing well in another post-bubble contraction.
As we have noting, the transition from "old" to "new" won't be easy.
The rally out of December was likely to be helped by the expected bounce in commodities and this worked out. The surge in precious metals reached its best in March and we reviewed the potential problems and advised taking money off the table.
The December low for gold at 1181 was likely the low against the bubble in financial assets. The Daily RSI was down to 30 and the swing to over 70 was very good. It is again approaching 30 as gold approached 1250.
Gold is poised to rally.
Silver is somewhat oversold at the 18 level which has offered support in June and in December. Despite this, in the pending contraction silver could get hammered relative to gold.
Both the contraction and silver's underperformance will be confirmed by the gold/silver ratio taking the next leg up. Getting to 67 was the first step and 68 was reached a couple of weeks ago. This was a key warning on the financial markets.
What's more, getting to 70 would be the equivalent of breaking above 60 in February 2000 and above 57 in August 2008.
The gold/silver ratio is at 66.5 today.
Recntly a name on the speaking circuit has been going on about that the Fed's recklessness will collapse the dollar and that would be the "catastrophe". Others are headlining the "Coming Monetary Collapse".
The Fed really needs speculators to drive asset prices up. Without the leverage Fed ambitions would be curbed. Quite likely as the bubble in bonds collapses the Fed will not be able to issue enough credit to offset the general contraction.
The next step is that most of the new issue of debt has been done in NY and obliged to be due and payable in US funds in New York. That represents a huge short position.
"They" will not be able to force a massive decline in the dollar.
The outlook is that gold can go up in dollar terms and in real terms. Gold and silver stocks will be vulnerable to liquidity problems in global stock markets.
On the "Coming Monetary Collapse", it won't be the dollar going to zero. It will be a highly offended public condemning central bankers with enough wrath to end the long experiment in manipulation. The dollar won't be trashed, the theories behind such intervention will be trashed. How about the "Coming Policymaker Collapse".
A gold standard is possible, so is some kind of "bit" currency.
Sub-Prime Mortgage Bonds

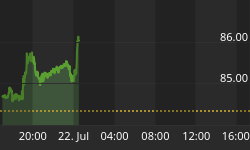
• The rally from 55.9 in February to 64.2 this week has been outstanding.
• The Fed has been a big buyer in this dreadful sector.
Gold/IA Commodity Index

• Most commodity indexes include gold, which implies that gold is a commodity.
• It is money.
• Last time we checked, The Economist All Items Commodities Index did not include gold.
• To determine gold's real price it is important that it is not in a commodity index.
• We created our own, with hopes that it would be similar to The Economist Index.
• Our Gold/Commodities Index declined with the boom that ended in 2007. Note that it turned up on May 21st, some three weeks before the credit markets turned to the "Train Wreck" in June 2007.
• Then it reversed on February 20th to down a few weeks before the panic ended in March 2009.
• The decline since 2011 has not been good for the precious metals sector.
• It has been associated with the bubble in financial assets and is becoming "oversold".
• We are watching for the reversal.
Link to May 30, 2014 Bob Hoye interview on TalkDigitalNetwork: http://talkdigitalnetwork.com/2014/05/stocks-could-still-rise/


