


With several leading financial markets racing upward to near-term highs, the question is how much longer can U.S. stocks ignore the upward bias in the price of crude oil and the dollar? We'll find out the answer in the next few days, but my guess is that stocks will start to show signs of weakness as the crude price makes another attempt at testing the upper boundary of its recent trading channel (which we'll examine here).
In my previous crude oil commentary I wrote, "The daily crude oil chart suggests that the oil price will continue to drift sideways-to-higher to slightly above $60/barrel in the coming weeks before strong resistance is encountered. My best 'guestimate' is that this latest rally meets its terminus somewhere between approximately $62-$64."
Now that $62/barrel has been tested on an intraday basis, is the top in for crude? Charts suggest that a final stab at $62-$64 may be in the works. This is especially true since the immediate-term uptrend channel for oil hasn't been decisively broken yet, and the mid-point of the latest parabolic dome in the crude oil daily chart hasn't been reached yet. This gives the oil price a chance at making a higher high since the cycle is still in the process of peaking. See chart below.

Another point worth mentioning is that the dominant short-term moving averages for crude oil - the 30/60/90-day MAs - are still in a bullish configuration with the 30-day MA in the rising position and the 60-day MA about to cross above the 90-day MA. This would put these moving average in their proper alignment to each other and should provide at least one final upside boost to an attempt at re-testing the upper boundary of the latest trading channel.

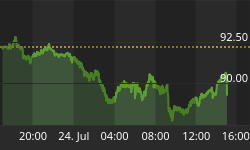
The rally in the U.S. dollar index has been almost as extreme as the previous decline was. This is probably to make up for the dollar overshooting on the downside. The dollar hasn't yet settled into its "ideal" range (as judged by the Fed) and could rally further above the recent high above 90.00. After a brief resting/consolidation period, and assuming a successful test of the up-curve in the daily chart, a further advance to between 91.00-92.00 is possible later this month. The important thing to consider is that the upward momentum for the dollar is still there and hasn't dissipated yet.


