


6/19/2014 9:29:02 AM
Fed releases the dot chart...
Recommendation: Take no action.
Click here to access our stock market chat rooms today! For a limited time, try our chat room for free. No subscription necessary to give it a try.
Stock Market Trends:

- ETF Positions indicated as Green are Long ETF positions and those indicated as Red are short positions.
- The State of the stock market is used to determine how you should trade. A trending market can ignore support and resistance levels and maintain its direction longer than most traders think it will.
- The BIAS is used to determine how aggressive or defensive you should be with an ETF position. If the BIAS is Bullish but the stock market is in a Trading state, you might enter a short trade to take advantage of a reversal off of resistance. The BIAS tells you to exit that ETF trade on "weaker" signals than you might otherwise trade on as the stock market is predisposed to move in the direction of BIAS.
- At Risk is generally neutral represented by "-". When it is "Bullish" or "Bearish" it warns of a potential change in the BIAS.
- The Moving Averages are noted as they are important signposts used by the Chartists community in determining the relative health of the markets.
Best ETFs to buy now (current positions):
Long DIA at $161.48 as of December 19, 2013
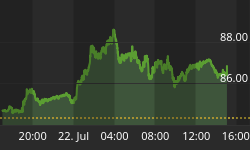
Long QQQ at $85.99 as of December 19, 2013
Long SPY at $181.19 as of December 19, 2013
Click here to learn more about my services and for our ETF Trend Trading.
Value Portfolio:
Long SDRL at $33.90 on June 15, 2012 (Shares were put to us when options expired. We were paid $1.10 per share when we sold those options and bought shares for $35.00 each.) We have collected dividends: June 10, 2014 $1.00, March 5, 2014 $0.98, December 3, 2013 $0.95, September 5, 2013 $0.91, June 5, 2013 $0.88, $1.70 Dec 4, 2012, $0.84 Sep 4, 2012. Total = $6.28 in dividend payments.
Short FXE at $124.19 on August 24, 2012
Long UUP at $22.43 on August 24, 2012
Short FXE at $134.48 on October 4, 2013
Long SDRL at $35.43 on Feb 18, 2014
Long SDRL at $33.50 on March 21, 2014 (Shares were put to us when options expired. We were paid $1.50 per share when we sold those options and bought the shares for $35.00 each.) We have collected dividends: June 10, 2014 $1.00.
We publish new reports to our free newsletter every month. If you're not a member, sign up by clicking here: Free Stock Market Newsletter
Equities opened modestly higher and definitely moved lower early in the session. The release of the Fed policy statement saw buyers come out of the woodwork as the fed signaled a slow and steady exit to QE (Quantitative Easing) and a like interest rate raise beginning in 2015. The result was buying into the close forcing all equity indexes that we monitor to record gains, with the noted exception of the Semiconductor Index (SOX 633.20 -2.29). All equity indexes but the Dow Jones Transports (IYT 146.93 +2.15) are in uptrend states and the transports will likely shift to an uptrend state on Thursday. All equity indexes are trading above their 20-, 50-, and 200-Day Moving Averages (DMAs) and all have a BULLISH BIAS. Longer Term Bonds (TLT 112.40 +0.96) added a nice fractional gain to close even with its 20-DMA and above its 50- and 200-DMAs. It shifted to a NEUTRAL BIAS. It maintains a trading state. Trading volume increased but remained light with 628M shares traded on the NYSE. Trading volume on the NASDAQ increased to nearly average with 1.863B shares traded.
There were two economic reports of interest released:
- MBA Mortgage Index fell -9.2% last week versus the prior week's +10.3%
- Current Account Balance (Q1) came in at -$111.1B versus an expected -$97.8B
Both reports were released an hour or more before the open.
The Fed maintained its target interest rate at between zero and 0.25%. It also announced a further reduction of $10B in monthly purchases. That reduces the Fed's long term debt buying down to $35B per month. The Fed did say that they expect economic growth in 2014 to be lower that previously expected due to weather in Q1, and that this will not have a lasting effect on the economy.
The Fed's latest policy statement, by itself, provided no change to interest rates nor to expected action on QE. The release of the "dot chart" where all sixteen Fed officials weighed in on where they expect interest rates to be by the end of 2014, 2015, 2016, and beyond provides a glimpse behind the curtain. Although the Fed is not committed to following these expectations, and the expectations change, the market now has information to use, which makes the equity markets more stable. Fed Chairman, Janet Yellen, also commented that she did not believe the U.S. Stock market was overvalued at this time. Clearly, this is not a personal opinion but a comment by the Fed that they do not see a reason that this bubble should be burst at this time.

Apple (AAPL 92.18 +0.10) closed relatively flat. AAPL constitutes about 20 percent of the NASDAQ-100 and nearly five percent of the S&P-500.
Seadrill Limited (SDRL 39.67 +0.33) added most of one percent closing just below its 200-DMA. It has surpassed its recent high with the next target being $40.96, it's closing price on the last trading day of 2013. It is in an uptrend state. We sold March 2014 $35.00 put contracts for $150 at the open on Feb 18th,2014 and bought shares at $35.43. The stock is now trading ex-dividend for $0.98 and one dollar for total dividends issued of $1.98. The stock fell back to just below its 200-DMA. The shares were put to us at $35.00 less the $1.50 per share we were paid for the puts, so we have an effective price of $33.50.
The U.S. dollar fell three tenths of one percent while the Euro rose a like amount. The dollar continues to hover below its 200-DMA. The Euro is plumbing the depths at its recent lows. It closed well below its 200-DMA.
The yield for the 10-year treasuries closed down five basis points at 2.61. The price of a barrel of crude oil closed down thirty-nine cents at $105.97.
The implied volatility for the S&P-500 (VIX 10.61 -1.45) plummeted to the lowest level seen since 2006. The implied volatility for the NASDAQ-100 (VXN 12.65 -0.86) slid six percent to the lowest levels seen since March 2013 which was the lowest levels seen since before the financial crisis. What does it mean? It means that there is a remarkable amount of complacency out there, but, the Fed has made it clear that their view of interest rates is to keep them low and stable for years.
Market internals were bullish. Advancers led decliners nearly 3:1 on the NYSE and by 3:2 on the NASDAQ. Up volume led down volume 4:1 on the NYSE and by 3:2 on the NASDAQ. The index put/call ratio fell -0.03 to close at 0.90. The equity put/call ratio closed 0.49.
Conclusion/Commentary
Many equities moved to new highs or are poised just below those levels. The S&P-500 closed at a new all time high and the Dow is just below its all time high. The NASDAQ-100 closed at a multi-year high while the canaries (Russell-2000, Bank Index, and Regional Bank Index) are poised to assault their highs made earlier this year. The leading indexes are leading the way higher so this is a bull market until proven otherwise. We will still look for a clear reversal sign and would like to enter a short trade then as too many market participants will see up as the only direction the market can go from here. We believe that as the Fed slowly comes off its QE program, the market will behave as in the past, that is, the market will become normal. That means there will be money to be made going both long and short. The Fed will end its QE program this year and will eventually want to reduce its balance sheet of $5.5T in longer term debt. For now, we remain long.
We hope you have enjoyed this edition of the McMillan portfolio. You may send comments to mark@stockbarometer.com.


