


6/27/2014 8:57:51 AM
The bears send equities lower, but the bulls buy the dip...
Recommendation: Take no action.
Click here to access our stock market chat rooms today! For a limited time, try our chat room for free. No subscription necessary to give it a try.
Stock Market Trends:

- ETF Positions indicated as Green are Long ETF positions and those indicated as Red are short positions.
- The State of the stock market is used to determine how you should trade. A trending market can ignore support and resistance levels and maintain its direction longer than most traders think it will.
- The BIAS is used to determine how aggressive or defensive you should be with an ETF position. If the BIAS is Bullish but the stock market is in a Trading state, you might enter a short trade to take advantage of a reversal off of resistance. The BIAS tells you to exit that ETF trade on "weaker" signals than you might otherwise trade on as the stock market is predisposed to move in the direction of BIAS.
- At Risk is generally neutral represented by "-". When it is "Bullish" or "Bearish" it warns of a potential change in the BIAS.
- The Moving Averages are noted as they are important signposts used by the Chartists community in determining the relative health of the markets.
Best ETFs to buy now (current positions):
Long DIA at $161.48 as of December 19, 2013
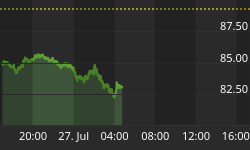
Long QQQ at $85.99 as of December 19, 2013
Long SPY at $181.19 as of December 19, 2013
Click here to learn more about my services and for our ETF Trend Trading.
Value Portfolio:
Long SDRL at $33.90 on June 15, 2012 (Shares were put to us when options expired. We were paid $1.10 per share when we sold those options and bought shares for $35.00 each.) We have collected dividends: June 10, 2014 $1.00, March 5, 2014 $0.98, December 3, 2013 $0.95, September 5, 2013 $0.91, June 5, 2013 $0.88, $1.70 Dec 4, 2012, $0.84 Sep 4, 2012. Total = $6.28 in dividend payments.
Short FXE at $124.19 on August 24, 2012
Long UUP at $22.43 on August 24, 2012
Short FXE at $134.48 on October 4, 2013
Long SDRL at $35.43 on Feb 18, 2014
Long SDRL at $33.50 on March 21, 2014 (Shares were put to us when options expired. We were paid $1.50 per share when we sold those options and bought the shares for $35.00 each.) We have collected dividends: June 10, 2014 $1.00.
We publish new reports to our free newsletter every month. If you're not a member, sign up by clicking here: Free Stock Market Newsletter
Equities took an immediate dive after a relatively flat open. The end of this move occurred about one half hour into the session and the bulls kept buying the rest of the day. This resulted in small losses for the Dow and S&P-500 and a modest gain for the NASDAQ-100. This was enough for the Dow to close even with its 20-Day Moving Average (DMA) which also occurred for the Finance Sector ETF (XLF 22.67 -0.08). All other equity indexes we regularly monitor remain above their 20-, 50-, and 200-DMAs. Only the NASDAQ-100 maintained its uptrend state with all other equity indexes in trading states. The Dow Jones Transport Index (IYT 146.19 -0.19), the Semiconductor Index (SOX 628.27 -2.59),and the Russell-2000 (IWM 117.55 -0.20) posted fractional losses. The Bank Index (KBE 33.30 -0.01) closed flat and the Regional Bank Index (KRE 40.18 +0.06) actually posted a modest gain. All equity indexes remain with a BULLISH BIAS. Longer Term Bonds (TLT 113.41 +0.54) posted a fractional gain, closed above its 20-, 50-, and 200-DMAs, has a NEUTRAL BIAS, and is in an uptrend state. Trading volume fell to very light with 592M shares traded on the NYSE. Trading volume on the NASDAQ fell to a light 1.542B shares traded.
There were five economic reports of interest released:
• Initial Jobless Claims for last week came in at 312K versus an expected 310K
• Continuing Jobless Claims for last week came in at 2.571M versus an expected 2.588M
• Personal Income (May) rose +0.4% as expected
• Personal Spending (May) rose +0.2% versus an expected +0.4% rise
• PCE Prices - Core (May) rose +0.2% as expected
All five reports were released an hour or more before the open.
Apple (AAPL 90.90 +0.54) added more than one half of one percent. It had been falling since a 7:1 stock split on June 8th. AAPL constitutes about 20 percent of the NASDAQ-100 and nearly five percent of the S&P-500.
Seadrill Limited (SDRL 39.18 -0.01) closed flat. The next target above remains $40.96, it's closing price on the last trading day of 2013. It is in an uptrend state. We sold March 2014 $35.00 put contracts for $150 at the open on Feb 18th, 2014 and bought shares at $35.43. The stock is now trading ex-dividend for $0.98 and one dollar for total dividends issued of $1.98. The stock fell back to just below its 200-DMA. The shares were put to us at $35.00 less the $1.50 per share we were paid for the puts, so we have an effective price of $33.50.
The U.S. dollar was relatively unchanged while the Euro fell more than a tenth of one percent. The dollar continues to trade below its 200-DMA as the Euro approaches the bottom side of its 200-DMA.
The yield for the 10-year treasuries fell three basis points to close at 2.53. The price of a barrel of crude oil fell sixty-six cents to close at $105.84.
The implied volatility for the S&P-500 (VIX 11.63 +0.04) closed nearly unchange. The implied volatility for the NASDAQ-100 (VXN 12.20 -0.34) fell nearly three percent. Both measures are still well below their respective 200-DMAs.
Market internals were mixed. Advancers led decliners 10:9 on the NYSE while decliners led advancers by the same ration on the NASDAQ. Up volume edged down volume on both the NYSE and the NASDAQ. The index put/call ratio fell -0.09 to close at 1.05 equity put/call ratio rose +0.09 to close at 0.58.
Conclusion/Commentary
Thursday saw the bears push things down toward Wednesday's lows from the open but the bulls stepped in to buy to force prices to close relatively unchanged. With things relatively balanced, the bulls still enjoy an intermediate bias but, short term trading could really go either way. With the NASDAQ-100 posting a modest gain, we will give the bulls another session to see if they can put something together. Until something changes, we will remain long.
We hope you have enjoyed this edition of the McMillan portfolio. You may send comments to mark@stockbarometer.com.


