


7/2/2014 8:54:19 AM
The bulls own the day...
Recommendation: Take no action.
Click here to access our stock market chat rooms today! For a limited time, try our chat room for free. No subscription necessary to give it a try.
Stock Market Trends:

- ETF Positions indicated as Green are Long ETF positions and those indicated as Red are short positions.
- The State of the stock market is used to determine how you should trade. A trending market can ignore support and resistance levels and maintain its direction longer than most traders think it will.
- The BIAS is used to determine how aggressive or defensive you should be with an ETF position. If the BIAS is Bullish but the stock market is in a Trading state, you might enter a short trade to take advantage of a reversal off of resistance. The BIAS tells you to exit that ETF trade on "weaker" signals than you might otherwise trade on as the stock market is predisposed to move in the direction of BIAS.
- At Risk is generally neutral represented by "-". When it is "Bullish" or "Bearish" it warns of a potential change in the BIAS.
- The Moving Averages are noted as they are important signposts used by the Chartists community in determining the relative health of the markets.
Best ETFs to buy now (current positions):
Long DIA at $161.48 as of December 19, 2013
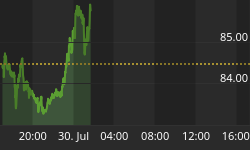
Long QQQ at $85.99 as of December 19, 2013
Long SPY at $181.19 as of December 19, 2013
Click here to learn more about my services and for our ETF Trend Trading.
Value Portfolio:
Long SDRL at $33.90 on June 15, 2012 (Shares were put to us when options expired. We were paid $1.10 per share when we sold those options and bought shares for $35.00 each.) We have collected dividends: June 10, 2014 $1.00, March 5, 2014 $0.98, December 3, 2013 $0.95, September 5, 2013 $0.91, June 5, 2013 $0.88, $1.70 Dec 4, 2012, $0.84 Sep 4, 2012. Total = $6.28 in dividend payments.
Short FXE at $124.19 on August 24, 2012
Long UUP at $22.43 on August 24, 2012
Short FXE at $134.48 on October 4, 2013
Long SDRL at $35.43 on Feb 18, 2014
Long SDRL at $33.50 on March 21, 2014 (Shares were put to us when options expired. We were paid $1.50 per share when we sold those options and bought the shares for $35.00 each.) We have collected dividends: June 10, 2014 $1.00.
We publish new reports to our free newsletter every month. If you're not a member, sign up by clicking here: Free Stock Market Newsletter
Equities saw a gap up open turn into a follow-on run higher through most of the session. Only in the final hour did equities give back some of those gains which happened mostly in the final forty-five minutes. Still, all equity indexes that we regularly monitor added strong fractional gains or gains of more than one percent. All equity indexes we regularly monitor closed above their 20-, 50-, and 200 Day Moving Averages (DMAs), are in uptrend states, and have a BULLISH BIAS. Longer Term Bonds (TLT 112.28 -0.66) posted a fractional loss, shifted to a trading state and closed just above its 20- and 50-DMAs. It has a NEUTRAL BIAS. Trading volume remained light with 560M shares traded on the NYSE. Trading volume on the NASDAQ remained average with 1.902B shares traded.
There were four economic reports of interest released:
• ISM Index (Jun) came in at 55.3 versus an expected 55.8
• Construction Spending (May) rose 0.1% versus an expected +0.4% rise
• Auto Sales (Jun) came in at 5.9M versus May's 5.7M
• Truck Sales (Jun) came in at 7.5M versus May's 7.7M
The first two reports were released a half hour into the session. The auto and truck reports actually trickle in through the entire day as different manufacturers report. They represent a summation.
Apple (AAPL 93.52 +0.59) added a fraction of one percent. It had been falling since a 7:1 stock split on June 8th but appears to be in rally mode now. AAPL constitutes about 20 percent of the NASDAQ-100 and nearly five percent of the S&P-500.
Seadrill Limited (SDRL 39.88 -0.07) posted a modest loss. The next target above remains $40.96, it's closing price on the last trading day of 2013. It is in an uptrend state. We sold March 2014 $35.00 put contracts for $150 at the open on Feb 18th, 2014 and bought shares at $35.43. The stock is now trading ex-dividend for $0.98 and one dollar for total dividends issued of $1.98. The stock fell back to just below its 200-DMA. The shares were put to us at $35.00 less the $1.50 per share we were paid for the puts, so we have an effective price of $33.50.
The U.S. dollar rose almost imperceptibly. The Euro fell a tenth of one percent. The dollar continues to trade below its 200-DMA while the Euro closed even with its respective 200-DMA.
The yield for the 10-year treasuries rose four basis points to close at 2.56. The price of a barrel of crude oil fell three cents to close at $105.34.
The implied volatility for the S&P-500 (VIX 11.15 -0.42) fell nearly four percent. The implied volatility for the NASDAQ-100 (VXN 11.98 -0.23) fell two percent to the lowest level ever recorded.
Market internals were bullish. Advancers led decliners 2:1 on the NYSE and by nearly 3:1 on the NASDAQ. Up volume led down volume 2:1 on the NYSE and by 4:1 on the NASDAQ. The index put/call ratio fell -0.26 to close at 1.05 equity put/call ratio rose +0.01 to close at 0.51.
Conclusion/Commentary
The bulls came out swinging and drove prices to record highs with the lowest implied volatility ever recorded for the NASDAQ-100. Even though volume was light to average, it appears that the bears can not put together a string of wins at this time. All equity indexes we regularly monitor are in uptrend states and the longer term bonds shifted from an uptrend state to a trading state. We continue to monitor the gold miners (GDX 26.24 -0.21) for a potential top here. We will remain long equities until we see signs of a reversal.
We hope you have enjoyed this edition of the McMillan portfolio. You may send comments to mark@stockbarometer.com.


