


7/3/2014 8:52:30 AM
Banks hard hit but other equities not so much...
Recommendation: Take no action.
Click here to access our stock market chat rooms today! For a limited time, try our chat room for free. No subscription necessary to give it a try.
Stock Market Trends:

- ETF Positions indicated as Green are Long ETF positions and those indicated as Red are short positions.
- The State of the stock market is used to determine how you should trade. A trending market can ignore support and resistance levels and maintain its direction longer than most traders think it will.
- The BIAS is used to determine how aggressive or defensive you should be with an ETF position. If the BIAS is Bullish but the stock market is in a Trading state, you might enter a short trade to take advantage of a reversal off of resistance. The BIAS tells you to exit that ETF trade on "weaker" signals than you might otherwise trade on as the stock market is predisposed to move in the direction of BIAS.
- At Risk is generally neutral represented by "-". When it is "Bullish" or "Bearish" it warns of a potential change in the BIAS.
- The Moving Averages are noted as they are important signposts used by the Chartists community in determining the relative health of the markets.
Best ETFs to buy now (current positions):
Long DIA at $161.48 as of December 19, 2013
Long QQQ at $85.99 as of December 19, 2013
Long SPY at $181.19 as of December 19, 2013
Click here to learn more about my services and for our ETF Trend Trading.
Value Portfolio:
Long SDRL at $33.90 on June 15, 2012 (Shares were put to us when options expired. We were paid $1.10 per share when we sold those options and bought shares for $35.00 each.) We have collected dividends: June 10, 2014 $1.00, March 5, 2014 $0.98, December 3, 2013 $0.95, September 5, 2013 $0.91, June 5, 2013 $0.88, $1.70 Dec 4, 2012, $0.84 Sep 4, 2012. Total = $6.28 in dividend payments.
Short FXE at $124.19 on August 24, 2012
Long UUP at $22.43 on August 24, 2012
Short FXE at $134.48 on October 4, 2013
Long SDRL at $35.43 on Feb 18, 2014
Long SDRL at $33.50 on March 21, 2014 (Shares were put to us when options expired. We were paid $1.50 per share when we sold those options and bought the shares for $35.00 each.) We have collected dividends: June 10, 2014 $1.00.
We publish new reports to our free newsletter every month. If you're not a member, sign up by clicking here: Free Stock Market Newsletter
Equities traded in a tight range and when the closing bell rang, the Dow closed modestly lower, the S&P-500 closed modestly higher and the NASDAQ-100 closed with a somewhat modest fractional gain. All equity indexes we regularly monitor closed above their 20-, 50-, and 200-Day Moving Averages (DMAs). All have a BULLISH BIAS and are in uptrend states. The Bank Index (KBE 33.47 -0.24) and Regional Bank Index (KRE 40.46 -0.37) were the hardest hit of the equity indexes we regularly monitor with some indexes recording modest gains and some modest losses. Longer Term Bonds (TLT 111.08 -1.10) fell one percent closing below its 20- and 50-DMAs and remaining in a trading state. It maintains a NEUTRAL BIAS. Trading volume was the same as on Tuesday with a light 560M shares traded on the NYSE. Trading volume on the NASDAQ fell to light with 1.578B shares traded.
In addition to the crude oil inventory report, there were three economic reports of interest released:
• MBA Mortgage Index for last week fell -0.2%
• ADP Employment Change (Jun) came in at +281K jobs versus an expected +200K
• Factory Orders (May) fell -0.5% versus an expected -0.4%
The first two reports were released before the bell while Factory Orders came out a half hour after the open.
Apple (AAPL 93.48 -0.04) closed relatively flat. AAPL constitutes about 20 percent of the NASDAQ-100 and nearly five percent of the S&P-500.
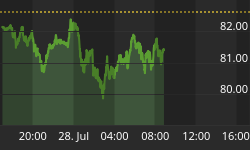
Seadrill Limited (SDRL 39.95 +0.07) posted a modest gain. The next target above remains $40.96, it's closing price on the last trading day of 2013. It is in an uptrend state. We sold March 2014 $35.00 put contracts for $150 at the open on Feb 18th, 2014 and bought shares at $35.43. The stock is now trading ex-dividend for $0.98 and one dollar for total dividends issued of $1.98. The stock fell back to just below its 200-DMA. The shares were put to us at $35.00 less the $1.50 per share we were paid for the puts, so we have an effective price of $33.50.
The U.S. dollar rose two tenths of one percent while the Euro moved inversely to the dollar. The dollar continues to trade below its 200-DMA while the Euro closed just below its respective 200-DMA.
The yield for the 10-year treasuries rose seven basis points to close at 2.63. The price of a barrel of crude oil fell eighty-six cents to close at $104.48. The U.S. government reported a draw down of -3.155M barrels of crude oil last week.
The implied volatility for the S&P-500 (VIX 10.82 -0.33) fell three percent nearly down to a multi-year low. The implied volatility for the NASDAQ-100 (VXN 11.59 -0.39) fell three percent to the lowest level ever recorded.
Market internals were mixed. Decliners led advancers 5:3 on the NYSE and by 5:4 on the NASDAQ. Up volume edged down volume on the NYSE while the opposite was the case on the NASDAQ. The index put/call ratio fell -0.01 to close at 1.04 equity put/call ratio rose +0.06 to close at 0.57.
Conclusion/Commentary
Wednesday's trading action was somewhat predictable. After the outsized gains on Tuesday, it was likely that stocks would take a bit of a break. With that said, some equity indexes did manage gains and trading volume was balanced between up and down volume. Longer term bond prices are breaking down, and while a rout has not yet occurred, we believe that prices are likely headed lower for a more protracted period and this change will be obvious to all soon. Gold miners (GDX 26.48 +0.24) set themselves up for a short trade. We will short GDX if we can get a decent entry price of $26.38 or higher. We will remain long equities until we see signs of a reversal.
We hope you have enjoyed this edition of the McMillan portfolio. You may send comments to mark@stockbarometer.com.


