


The good news is:
• Several of the major indices including the S&P 500 (SPX),Russell 3000, Russell 2000 (R2K), S&P mid cap, Valueline and Wilshire 5000hit multiyear highs last week. All time highs were attained for the mid and smallcap indices.
The highest number of new highs on both the NYSE and NASDAQ were recorded on Monday at 488 on the NYSE and 254 on the NASDAQ. While the indices rose all week long, new highs were falling to their lows of the week at 99 on the NYSE and 89 on the NASDAQ. The declines were enough to turn both the NYSE and NASDAQ new high indicators downward.
The new high indicator is a 10% trend (19 day EMA) of new highs. It is short term and sometimes leads, but usually lags by a day or two. The chart below shows the past three months with the NASDAQ composite (OTC) in red and the NASDAQ new high indicator in green. The dramatic fall off of new highs while the indices were steadily rising suggests weakness in the short term.

The market is overbought.
I have approximately 11 years of data on the Philadelphia Semiconductor Index (SOX). During that period the index has on three occasions had runs of 9 consecutive up days. The first ended on 8/17/1994 after which the index fell 1.3% in the next 5 trading days. The second ended 5/23/1995 after which the index fell 9.9% in the next 4 trading days. The third ended last Thursday and the index declined 0.1% on Friday.
As of Friday, several indices including the OTC, NDX, SPX, Russell 3000 and Wilshire 5000 have been up for 7 consecutive days. On average, we see this happen about once a year often corresponding with a short term high. Conspicuously missing from the list is the R2K. The R2K hit an all time high on Monday then declined for the next three consecutive days before rallying 0.1% on Friday. The small caps represented by the R2K usually lead both up and down.
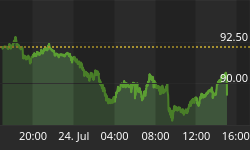
The chart below shows the Russell 2000 (R2K) in red, the S&P 500 (SPX) in green and a FastTrack relative strength indicator called Accutrack as a histogram in yellow.

Last week Accutrack turned downward indicating the small caps are underperforming the blue chips.
Seasonally the week following the 3rd Friday in July is usually weak, however, that is not the case during the 1st year of the presidential cycle. The OTC has been up 70% of the time during this period, however, the average return is a loss because of a couple very bad years in the mid and late 1960's.
There have been two notable extremes in the upcoming week, the OTC has been down 70% of the time on Monday and up 90% of the time on Friday.
The tables below show data for the 1st year of the presidential cycle from 1965 for the OTC and from 1929 for the SPX. There are summaries for all years from 1963 for the OTC and 1928 for the SPX.
Report for the week following the 3rd Friday in July.
The number following the year is its position in the presidential cycle.
| OTC Presidential Year 1 | ||||||
| Year | Mon | Tue | Wed | Thur | Fri | Totals |
| 1965-1 | -1.67% | 0.12% | -1.20% | -0.46% | -0.42% | -3.63% |
| 1969-1 | -1.39% | -1.63% | -1.33% | -0.58% | 1.09% | -3.84% |
| 1973-1 | 0.07% | 0.50% | 0.83% | -0.02% | 0.17% | 1.55% |
| 1977-1 | 0.59% | 0.36% | 0.05% | 0.26% | 0.40% | 1.67% |
| 1981-1 | 0.68% | -0.24% | 0.02% | 0.52% | 0.76% | 1.74% |
| 1985-1 | -0.30% | -0.20% | -0.82% | 0.24% | 0.06% | -1.02% |
| 1989-1 | -0.74% | 0.11% | 0.59% | 0.75% | 0.08% | 0.79% |
| 1993-1 | -0.56% | 0.87% | -0.26% | -0.65% | 0.68% | 0.08% |
| 1997-1 | -0.39% | 0.56% | 1.00% | 0.36% | 0.03% | 1.57% |
| 2001-1 | -2.01% | -1.47% | 1.28% | 1.95% | 0.30% | 0.04% |
| OTC averages for all Presidential year 1 | ||||||
| Avg | -0.57% | -0.10% | 0.02% | 0.24% | 0.31% | -0.11% |
| Win% | 30% | 60% | 60% | 60% | 90% | 70% |
| OTC averages for all years 1963 - 2004 | ||||||
| Avg | -0.45% | -0.26% | 0.16% | 0.04% | -0.17% | -0.69% |
| Win% | 36% | 50% | 56% | 64% | 57% | 43% |
| SPX presidential year 1 | ||||||
| Year | Mon | Tue | Wed | Thur | Fri | Totals |
| 1929-1 | -1.32% | 1.41% | -0.66% | 0.45% | 0.00% | -0.12% |
| 1933-1 | 2.00% | -1.71% | 2.62% | 0.85% | 0.00% | 3.75% |
| 1937-1 | 1.82% | 1.19% | -0.71% | 0.30% | 0.00% | 2.61% |
| 1941-1 | 0.77% | -0.19% | -0.48% | -0.10% | 0.00% | 0.00% |
| 1945-1 | -1.02% | 0.21% | 0.96% | -2.04% | 0.49% | -1.41% |
| Avg | 0.45% | 0.18% | 0.35% | -0.11% | 0.49% | 0.97% |
| 1949-1 | 0.27% | 0.95% | 0.20% | -0.47% | -0.07% | 0.88% |
| 1953-1 | -0.53% | -0.25% | 0.12% | 0.17% | 0.00% | -0.49% |
| 1957-1 | -0.23% | 0.19% | 0.10% | 0.00% | -0.33% | -0.27% |
| 1961-1 | 0.02% | 0.55% | 0.94% | 1.17% | 0.15% | 2.83% |
| 1965-1 | -0.07% | -1.26% | -0.57% | -0.26% | 0.26% | -1.90% |
| Avg | -0.11% | 0.04% | 0.16% | 0.15% | 0.00% | 0.21% |
| 1969-1 | -1.90% | -0.81% | 0.50% | 2.11% | 1.79% | 1.69% |
| 1973-1 | 0.35% | 0.58% | 1.39% | 0.19% | -0.24% | 2.27% |
| 1977-1 | 0.77% | 0.83% | -0.06% | -0.14% | 0.08% | 1.48% |
| 1981-1 | 1.12% | -0.59% | 0.02% | 0.66% | 0.70% | 1.91% |
| 1985-1 | -0.40% | -0.93% | -0.50% | 0.25% | 0.18% | -1.40% |
| Avg | -0.01% | -0.18% | 0.27% | 0.62% | 0.50% | 1.19% |
| 1989-1 | -0.66% | 0.06% | 1.25% | 1.17% | 0.05% | 1.86% |
| 1993-1 | 0.06% | 0.29% | -0.03% | -0.60% | 0.58% | 0.31% |
| 1997-1 | -0.25% | 0.62% | 1.06% | 0.21% | -0.75% | 0.90% |
| 2001-1 | -1.64% | -1.63% | 1.61% | 1.04% | 0.24% | -0.37% |
| Avg | -0.62% | -0.16% | 0.97% | 0.46% | 0.03% | 0.67% |
| SPX averages for all Persidential year 1 | ||||||
| Avg | -0.04% | -0.03% | 0.41% | 0.28% | 0.22% | 0.76% |
| Win% | 47% | 58% | 63% | 67% | 71% | 63% |
| SPX averages for all years 1928 - 2004 | ||||||
| Avg | -0.20% | -0.12% | 0.23% | 0.16% | -0.03% | 0.04% |
| Win% | 39% | 51% | 62% | 66% | 57% | 53% |
There was quite a bit of internal deterioration last week suggesting short term weakness ahead. There was no build up of new lows on either the NYSE or NASDAQ so the weakness should be just short term.
I expect the major indices to be lower on Friday July 22 than they were on Friday July 15.
This report is free to anyone who wants it, so please tell your friends. If it is not for you, reply with REMOVE in the subject line.


