


Originally published July 13th, 2014.
Whilst acknowledging that "this time it could be different" we have no choice but to call gold and silver lower on the basis of their latest extraordinary COT charts, which reveal that the normally wrong Large specs are already "betting the farm" on this rally. This is especially the case with silver where the Commercial short and Large Spec long positions are already way in excess of what we saw at the March peak.
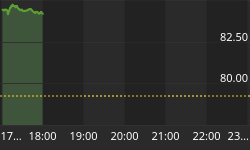
Let's start by looking at the latest 6-month chart for silver. On this chart we can see that following its big up day in mid-June silver has only made incremental gains, creeping higher by about 75 cents over the past several weeks.

The 1-year chart will enable us to make a direct comparison with the latest COT chart placed right below it, which goes back about a year...


By comparing these 2 charts we can see how the peak and troughs in the silver price have a strong correspondence with the peaks and troughs in Large Spec long positions. What is truly startling about the latest COT chart is the extraordinary explosion in Commercial short and Large Spec long positions in recent weeks, with readings way in excess of what we saw at the March peak, so that the COT structure for silver is much more extreme than that for gold, which itself is at a 1-year record by a wide margin. If history is precedent this points to an imminent reversal and significant drop by silver.
To repeat what was written in the parallel Gold Market update, the crux of our argument is this. If this apparent new uptrend has got legs, then COT positions, both Commercial short and Large Spec long positions should build up steadily as the uptrend proceeds towards an eventual peak when the uptrend is mature - not explode to huge levels right at the get-go. There is an argument that "this time it's different" and that on this occasion the Commercials are wrong, and when they realize that they are, they are going to rush to cover and create a meltup. The chances of this being the case are considered to be low, and you need to be brave, and perhaps stupid to place bets on the basis of it. We should not forget that the Commercials have unlimited ammo to throw at the paper price to make sure that their will prevails.

The long-term chart for silver continues to look promising, so one scenario here is that silver now backs off one last time towards its lows, before the expected major new uptrend begins.


