


Retirement: Is Your Due Diligence Complete?

While building a growth-and-income portfolio for retirement, many investors have properly addressed steps 1, 2, and 3 in the list below. As we will demonstrate via step 4, portfolios consisting of a diversified basket of blue-chip dividend payers may leave investors exposed to higher than anticipated risks in a bear market. Therefore, adding step 5 to your prudent dividend approach can improve your odds of protecting and growing your retirement nest egg in both bull and bear markets.
Due Diligence Steps
- Secure income using Dividend Champions screen.
- Diversify across all major S&P 500 sectors to reduce volatility and risk.
- Check valuations and fundamentals.
- Check portfolio's performance in bear market.
- Develop a specific exit strategy/risk management plan.
A Well-Constructed Portfolio
Since our firm focuses on all asset classes and market sectors, we will let the retirement experts help us build a prudent growth-and-income portfolio to use as a basis for this risk management exercise. Since the benefits of dividends are well documented and many retirees need income, we started with an excellent list, the Dividend Champions. The vast majority (88%) of the stocks in our hypothetical portfolio (see below) are current Dividend Champions. We also used Chuck Carnevale's excellent fundamental screens to help us with the security selection process. The vast majority (83%) of our portfolio below passed one of Mr. Carnevale's relatively recent screens, which can found in these articles:
- Is Dow 17,000 Dangerously High?
- Protecting Your Income Portfolios
- 20 Dividend Champions To Buy Today
In the table below, if the column Pass Recent Value Screen? has a "yes", the stock appeared and passed screens in one of the three articles above. We added a few stocks outside the screens for diversification purposes. We wanted to have at least two stocks from each major S&P 500 sector. Since financial stocks tend to perform well on valuation and income screens, we added a couple of extra consumer staples stocks to offset the added risk of over-weighting financials. The portfolio consists of Target (TGT), Genuine Parts (GPC), Altria Group (MO), Procter & Gamble (PG), Wal-Mart (WMT), Archer Daniels Midland (ADM), Chevron (CVX), Exxon Mobil (XOM), AFLAC (AFL), Franklin Resources (BEN), Community Trust Bancorp (CTBI), Eaton Vance (EV), Johnson & Johnson (JNJ), Medtronic (MDT), Stanley Black & Decker (SWK), 3M (MMM), HB Fuller (FUL), PPG Industries (PPG), Automatic Data Processing (ADP), International Business Machines (IBM), AT&T (T), Verizon (VZ), Consolidated Edison (ED), and Southern Company (SO).

STEP 4: Test Portfolio In Bear Market
In the minds of many investors, one of the objectives of investing in established blue-chip stocks is to reduce risk in next inevitable bear market. The table below shows the performance of each stock during the last bear market.

STEP 5: Building A Risk Management Plan
The excellent list of Dividend Champions and fundamental screens are value-add steps in the due diligence process. However, the next logical question is:
How does an investor manage the portfolio when the next bear market arrives?
One possible answer is via a buy-and-hold strategy, which sounds good on paper, but is much, much harder to implement in the real world where you have to sleep at night.
Do You Have The Stomach For Buy And Hold?
How difficult and stressful would buy and hold have been day-by-day in the 2007-2009 bear market? To answer that question, we collected the daily adjusted closing prices (accounts for dividends) for each stock in our sample portfolio. The graph below assumes we had $500,000 allocated in equal amounts of $20,833.33 to each of the 24 stocks in the retirement portfolio. The maximum drawdown on the $500,000 portfolio during the last bear market was roughly 40%, which means what once was a $500,000 portfolio dropped to a low of roughly $300,000 in March 2009.

The purpose of the article is not to say buy and hold is not a relevant option for all investors, but rather to educate blue-chip investors on the potential downside risks of a buy and hold approach. It is stressful to see your $500,000 drop to $300,000. Many investors approaching retirement or in retirement have no desire to ride out a 40% drop. If you consider yourself in that group, then building a risk management/bear market contingency plan is a logical next step.
2008: There Was Nothing You Could Do, Right?
Just because you have been told there was nothing you could have done in 2008, that does not mean it is true. Markets are difficult. Investing is difficult. However, as outlined in this 2008 video, paying attention to observable evidence could have improved an investor's odds of mitigating (not eliminating) risk in the last bear market.
2003-2008: An Example With A Blue Chip Stock
Just as the 2008 video referenced above covers concepts and does not represent a complete portfolio management system, the same remarks apply to the hypothetical risk management example that follows. Our real world risk management system answers thousands of questions about the market, but we can explain the conceptual use of observable evidence as a risk management tool by answering three questions about Target (TGT). In our simplified system, we can only buy Target when all three answers to the questions are "yes". We can only sell Target when the answers to all three questions are "no".
- Is the price of Target above the 200-day (in red below)?
- Is the slope of Target's 200-day positive?
- Is Target's 50-day (in blue) above the 200-day?
The first time the answer to all three questions was "yes" in the chart below came when Target was trading at $28.80 in 2003. Assume we bought Target at $28.80. Now, we can only sell Target when all three questions are "no". Notice during the entire move from $28.80 to $46.46 (a 61% gain), we never get a sell signal. Yes, price dropped below the red 200-day in 2004 and 2005, but the answer to the other two questions were still "yes". We can only sell when all three answers are negative.

Simple Example Of Risk Reduction
The observable evidence (no predictions needed) hit "sell mode" in November 2007 (see below). After the sell signal Target fell from $45.66 to $22.72. Even this very simple system would have avoided holding Target during a 50% loss.

The chart below zooms in on 2008, showing the observable evidence clearly said "you cannot buy Target" when most investors were not sleeping very well. Yes, price went over the red 200-day in August 2008, but the answers to the other two questions were still "no", meaning our rules would not have allowed us to repurchase Target in 2008.

Are The 50-Day And 200-Day Perfect?
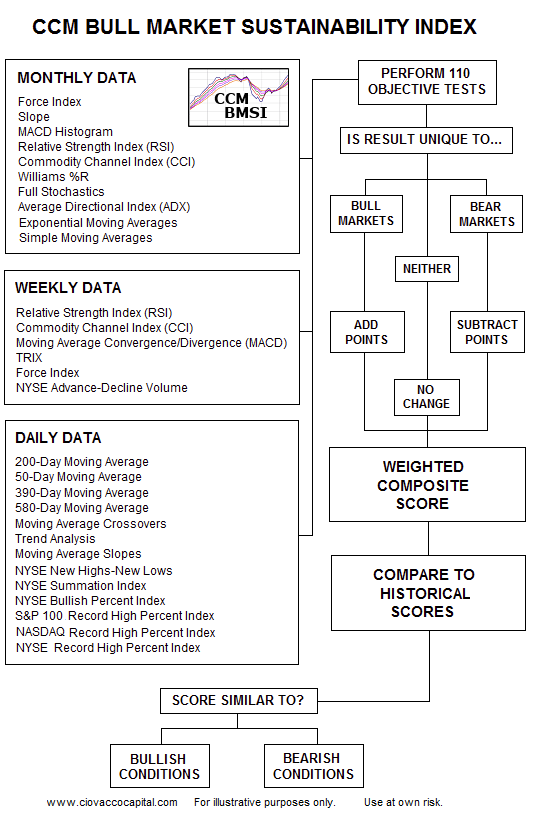
No, in fact, no moving average, indicator, or ratio represents the holy grail of risk management. Since the 50-day and 200-day can produce whipsaws from time to time, we do not recommend building a system based on these inputs only. However, the moving averages shown here do add value and can be used in conjunction with other "this can improve our odds of success" tools to build a diversified risk management system. This flow diagram is an example of using multiple hard and unbiased inputs on numerous time frames in a diversified manner.
More On Risk Management Systems
If you want to get your creative juices flowing and expand on the concepts presented above, the following articles may be of interest to you:
- You Will Never Look At The Markets The Same Way Again
- Tired Of Missing Rallies? 4 Ways To Improve Your Game
- 5 Reasons Your Simple Bear Market Plans Could Backfire
- The Most Important Thing For 2014
- With The Fed Stepping Back, Your Portfolio Needs You To Step Up And Lead
Investment Implications - A Few More Due Diligence Steps
To recap, many investors have checked most of the right boxes below:

Many investors have not completed the last two steps in the table above. The objective here is not to fear monger, but rather to encourage risk management reviews while the bull market sun is still shining. Once risk management plans are in place, the odds of sustaining hard-to-recover from losses will be reduced, not eliminated. All investing involves risk and uncertainty, but there are ways to reduce risk and uncertainty.
Can We Stock Pick Our Way Out Of A Bear Market?
It should be noted, we do not own any of the 24 stocks included in the hypothetical retirement portfolio, and do not have any plans to buy them, nor are we recommending them as possible investments. They are presented here for illustrative purposes. Numerous studies have found that roughly 90% of the investment battle is based on allocations (% stocks vs. % bonds) and only roughly 10% is based on picking individual stocks or companies. Said another way, it is very difficult to stock pick your way out of a bear market since most stocks drop. The results above align with these studies (23 of the 24 stocks lost money in the 2007-2009 bear market). More on allocation vs. security selection can be found here.


