


7/30/2014 9:21:41 AM
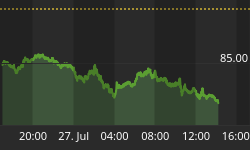
Russell-2000 signals a turnaround...
Recommendation: Take no action.
Click here to access our stock market chat rooms today! For a limited time, try our chat room for free. No subscription necessary to give it a try.
Stock Market Trends:

- ETF Positions indicated as Green are Long ETF positions and those indicated as Red are short positions.
- The State of the stock market is used to determine how you should trade. A trending market can ignore support and resistance levels and maintain its direction longer than most traders think it will.
- The BIAS is used to determine how aggressive or defensive you should be with an ETF position. If the BIAS is Bullish but the stock market is in a Trading state, you might enter a short trade to take advantage of a reversal off of resistance. The BIAS tells you to exit that ETF trade on "weaker" signals than you might otherwise trade on as the stock market is predisposed to move in the direction of BIAS.
- At Risk is generally neutral represented by "-". When it is "Bullish" or "Bearish" it warns of a potential change in the BIAS.
- The Moving Averages are noted as they are important signposts used by the Chartists community in determining the relative health of the markets.
Best ETFs to buy now (current positions):
Long DIA at $161.48 as of December 19, 2013
Long SPY at $181.19 as of December 19, 2013
Click here to learn more about my services and for our ETF Trend Trading.
Value Portfolio:
Long SDRL at $33.90 on June 15, 2012 (Shares were put to us when options expired. We were paid $1.10 per share when we sold those options and bought shares for $35.00 each.) We have collected dividends: June 10, 2014 $1.00, March 5, 2014 $0.98, December 3, 2013 $0.95, September 5, 2013 $0.91, June 5, 2013 $0.88, $1.70 Dec 4, 2012, $0.84 Sep 4, 2012. Total = $6.28 in dividend payments.
Short FXE at $124.19 on August 24, 2012
Long UUP at $22.43 on August 24, 2012
Short FXE at $134.48 on October 4, 2013
Long SDRL at $35.43 on Feb 18, 2014
Long SDRL at $33.50 on March 21, 2014 (Shares were put to us when options expired. We were paid $1.50 per share when we sold those options and bought the shares for $35.00 each.) We have collected dividends: June 10, 2014 $1.00.
We publish new reports to our free newsletter every month. If you're not a member, sign up by clicking here: Free Stock Market Newsletter
A small gap up was followed by a sell-off, then a rally, then a sell off into the close by the Dow and S&P-500. This left the Dow, S&P-500, and NASDAQ-100 with modest losses. Other equity indexes closed mixed The Dow is not in a weak downtrend state and it and the S&P-500 closed below their respective 20-Day Moving Averages (DMAs). All three closed above their 50- and 200-DMAs and have a BULLISH BIAS. The Semiconductor Index (SOX 614.42 -1.57) eased modestly while the Dow Jones Transports (IYT 147.12 -1.96) was crushed for a loss of more than one percent. This left both indexes below their 20-DMAs and with the Semis still below their 50-DMA. The Semis are also in a downtrend state. The Finance Sector ETF (XLF 22.78 -0.12) fell half of one percent to close below its 20-DMA. The three canaries all closed mixed: the Russell-2000 (IWM 113.34 +0.31) posted a fractional gain, the Bank Index (KBE 32.32 -0.05) a fractional loss, and the Regional Bank Index (KRE 38.71 +0.02) a modest gain. The Russell-2000 put in a potential bottoming pattern and is poised for a reversal. All three closed below their respective 20-, 50-, and 200-DMAs, All three are in trading states. All three maintain a BEARISH BIAS. Longer Term Bonds (TLT 115.93 +0.42) posted a fractional gain and appears to be putting in a top. It is, however, in an uptrend state and maintains a BULLISH BIAS and is above its 20-, 50-, and 200-DMAs. Trading volume remained light with 628M shares traded on the NYSE. Trading volume on the NASDAQ increased to average with 2.088B shares traded.
There were two economic reports of interest released:
• Case-Shiller 20-City Index (May) rose +9.3% versus an expected +10.0% rise
• Consumer Confidence (Jul) came in at 90.9 versus an expected 85.6
The first report was released a half hour before the open while the other report was released a half hour into the session.
Apple (AAPL 98.38 -0.64) posted a fractional loss after a week long rally. AAPL constitutes about 20 percent of the NASDAQ-100 and nearly five percent of the S&P-500.
Seadrill Limited (SDRL 36.49 -0.30) posted a fractional loss. It is in a downtrend state. We sold March 2014 $35.00 put contracts for $150 at the open on Feb 18th, 2014 and bought shares at $35.43. The stock is now trading ex-dividend for $0.98 and one dollar for total dividends issued of $1.98. The shares were put to us at $35.00 less the $1.50 per share we were paid for the puts, so we have an effective price of $33.50.
The U.S. dollar rose two tenths and the Euro moved inversely to it.
The yield for the 10-year treasuries was unchanged at 2.46. The price of a barrel of crude oil closed down seventycents to close at $100.97.
The implied volatility for the S&P-500 (VIX 13.28 +0.72) rose nearly six percent. This left the VIX not far below its 200-DMA. The implied volatility for the NASDAQ-100 (VXN 14.20 +0.36) rose two percent.
Market internals were mixed. Decliners led advancers 3:2 on the NYSE while advancers edged decliners on the NASDAQ. Down volume led up volume nearly 2:1 on the NYSE while up volume led down volume 5:4 on the NASDAQ. The index put/call ratio fell -0.05 to close at 1.07. The equity put/call ratio rose +0.01 to close at 0.60.
Conclusion/Commentary
Tuesday's mixed signals suggest the canaries will attempt a rally which may drag the major indexes along for the ride such that they may actually challenge their all time highs. There are so many cross currents under the surface right now. We will watch to see if the canaries sign on Wednesday.
We hope you have enjoyed this edition of the McMillan portfolio. You may send comments to mark@stockbarometer.com.


