


Precision timing for all time frames through a multi-dimensional approach to technical
analysis: Cycles - Breadth - P&F and Fibonacci price projections
and occasional Elliott Wave analysis
"By the Law of Periodical Repetition, everything which has happened once must happen again, and again, and again -- and not capriciously, but at regular periods, and each thing in its own period, not another's, and each obeying its own law... The same Nature which delights in periodical repetition in the sky is the Nature which orders the affairs of the earth. Let us not underrate the value of that hint." ~ Mark Twain
Current Position of the Market
SPX: Very Long-term trend - The very-long-term cycles are in their down phases, and if they make their lows when expected, there will be another steep decline into late 2014. However, the Fed policy of keeping interest rates low has severely curtailed the full downward pressure potential of the 40-yr and 120-yr cycles.
Intermediate trend - Intermediate correction is in process.
Analysis of the short-term trend is done on a daily basis with the help of hourly charts. It is an important adjunct to the analysis of daily and weekly charts which discusses the course of longer market trends.
SHORT-TERM LOW NEAR
Market Overview
Last week, I discussed the potential for one more minor high in the SPX followed by the beginning of an intermediate decline. I also mentioned an important caveat: the weakness in the DOW the previous week warned us that the intermediate top might have already arrived. Indeed it had, and when the trend line connecting SPX 1814 and 1862 was decisively broken, immediate weakness followed.
So, where do we stand after a 75-point decline? As we will see on the chart, we are approaching a substantial support level which also corresponds to a Point & Figure and Fibonacci projection at the time when VIX the P/C ratio and the daily A/D oscillator are trading at short-term extremes. Everything points to the end of this corrective phase by next week. Assuming that this is accurate, now the question is: "what kind of a correction have we started".
There are two possibilities: We may have started a decline which will take us into the much discussed October low, or this is another short-term low which will be followed by a new high - how improbable this may seem at the moment. The market itself should tell us over the next couple of weeks. If we have started a larger correction, next week's low will only be a short-term pause in a downtrend. If, on the other hand, strength immediately returns, then we should consider the alternative.
In the last letter, I also mentioned that the DOW was about to breach its long-term log trend line from 2009. It did just that last week, closing outside of it by a decisive margin. On the other hand, on an arithmetic scale, that trend line is still nearly 2000 points away. Only time will decide if the breaking of the log trend line has any meaning.
Chart Analysis
This week, we'll start with the SPX weekly chart (courtesy of QCharts.com, including the following three charts). The first chart gives us the long-term perspective from the start of the bull market in 2009. I have drawn two main channels to show the long-term strength of the index wnich went far beyond the main channel and continued to trade above it for about nine months.
A secondary, steeper channel was formed starting in October 2011 whose top line contained the index by stopping every advance, practically to the very last tick! There is no sign of deceleration; except that of a very overbought market which refused to correct until last week. I present this chart only to show that the odds of this being the beginning of a major correction are very small. So far, we have only broken a minor trend line and there are many more important ones which are ready to support the price before we put an end to the bull market. That does not mean that we couldn't still have a decline into year's end!

The next chart will be a close up of the same weekly chart, but starting at 1343 on 11/16/12. Here we see that only the minor trend line from 1814 has been decisively broken, but it also appears that we are working on the one which starts at 1738. And below that is the one which begins at 1343 and which is unlikely to be broken right away and should provide significant support for the current downtrend, especially since touching it will correspond with the support level and P&F and Fibonacci Projections, mentioned above. We'll have a better look at this trend line next, on the daily chart. The primary purpose of showing this chart is to examine the condition of the two oscillators at the bottom.
By both making a bearish cross, they have confirmed the beginning of an intermediate decline which was preceded by some negative divergence. If we expect to make a short-term low next week, will that give these two indicators the time to get back into a buy position? Very unlikely! So, if this is to be only a short-term downtrend followed by another uptrend, at the very least, we should spend some time at next week's low to allow these two oscillators to get back into a buy position. Again, the market will tell us if this is what it wants to do.

Now we'll turn to the daily chart for a more detailed analysis. Here we can see that we have broken not just one, but two trend lines, and that we are approaching the third one drawn from 1343. We should expect the last one to hold, at least temporarily. Support is also provided by the dashed trend.

line connecting many near-term closing lows which was discussed several weeks ago. In addition, since we have oversold oscillators and a P&F projection to the same level, we should get at least a consolidation period starting next week. Note that in April we had a similar correction, and an even larger one into February, and that both times the market pushed to higher highs, so we should not be too quick to dismiss that possibility once again. But the crystal ball that we will need to decide is already in place: if the trend line from 1433 is decisively broken, we will have started something more severe than just another short-term correction.
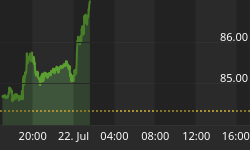
It is also important to look at the hourly chart to see if it supports the theory that we will be making a low next week. I think it does! The first bounce of the downtrend came on Friday at 1917. It was a CIT which came at 11:30 and provided some near-term relief for a severely oversold index. It topped 3 hours and 15 points later, and started down again. This could already be the move to the short-term low of around 1900. Or, the bounce may extend to about 11:30 on Monday before turning down again. In that case, the final low would either come on Tuesday or very early Wednesday.
The probability that we are approaching a low (already suggested with projections, support levels, etc...) is also reinforced by the behavior of the indicators which have turned up and will most likely need to turn down one more time and show some positive divergence at the low. There is an outside possibility that 1917 will turn out to be the low of the correction, but the odds of that are less than even. I have drawn several potential channels (which may still require final adjustments) that bracket the downtrend. In order to resume the uptrend, SPX will have to break out of them all. If the rally fails at any of the top channel lines and enough weakness reasserts itself to break the next trend line, we are going lower!

Cycles
"An 8-wk cycle was due at the end of last week. With an 11-day cycle topping over the week-end and a 9-day cycle due to top on Tuesday, the market could be vulnerable to additional short-term correction - another reason to be wary!"
I have mentioned time and time again that important cycles should make their lows around October. Perhaps they have finally topped and will exert continued downside pressure between now and then.
Breadth
The McClellan Oscillator and the Summation Index appear below (courtesy of StockCharts.com).
Both indicators took a beating last week. This is only the second time in the past year that the McClellan Oscillator dropped to that level. That makes it very oversold and ready for a spontaneous rally. The last time this happened (in September of last year), we came out of it with a Zweig Breadth Thrust which carried the market to a new high. If it happens again, we should know what to expect.
The NYSI came out of a year-long uptrend and has broken several important support levels. It did the same thing last year, but the market did not follow it lower. It could be different this time because of the October Cycles.


Sentiment Indicators
In spite of the sharp decline in the equities, the SentimenTrader (courtesy of same) long term indicator remains at 60 -- still slightly elevated.

VIX (CBOE volatility Index)
VIX has moved higher, but was stopped by the top of its declining channel. Its ability (or inability) to move out of that channel by rising higher still, will tell us a great deal about the market's intentions.

XLF (Financial ETF)
XLF corrected along with the market but, like SPX, it has good support from an important trend line just a little lower. At the very least, if it drops to that level, if should pause in a consolidation pattern before deciding on the next move.

TLT (20+yr Treasury Bond Fund)
TLT chose to respect the overhead resistance rather than to take advantage of the market correction to move higher. It is still in an uptrend and would have to break its trend line before changing course. It may not decide right away.

GLD (ETF for gold)
GLD is looking weaker and weaker. Its inability to follow up on the initial up-move is causing some concern about what may be in store down the road. It is currently finding support on its 200-DMA, but if it should break below instead of resuming its uptrend, it will be running the risk of making a new low in conjunction with the next 25-wk cycle low.

UUP (dollar ETF)
Chicken or egg, the dollar is taking advantage of gold's weakness to move sharply higher. It will soon be meeting with resistance at the mid-channel line and we will see if this move is for real, or just another meaningless squiggle in a long-term pattern that is going nowhere. Its ability to continue its advance will most likely increase the odds of gold becoming even weaker!

USO (US Oil Fund)
USO could not overcome the compound resistance at the 39 level and has now pulled back sharply. It has one more chance to stabilize at the compound support provided by the bottom channel line and 200-day DMA. It this does not arrest the decline, the next stop may very well be the bottom trend line of its long-tem channel.

Summary
Last week, SPX had its first significant correction since April. It will soon come into important support around 1900. This is expected to be tested next week and provide at least a pause in the decline. Part of that support is an intermediate trend line going back to November 2012. The level of this trend line will be a decision point for the index. If broken, we could see the decline continue into the October lows.
FREE TRIAL SUBSCRIPTON
Market Turning Points is an uncommonly dependable, reasonably priced service providing intra-day market updates, explanations, and commentary, plus detailed weekend reports. It is ideally suited to traders, but it can also be valuable to longer-term holders since price projections are provided using Point & Figure analysis along with best-time estimates obtained from cycle analysis.
For a FREE 4-week trial, Send an email to: ajg@cybertrails.com
For further subscription options, payment plans, weekly newsletters, and for general information, I encourage you to visit my NEW website at www.marketurningpoints.com. By clicking on "Free Newsletter" you can bring up the latest newsletter which is normally posted on Sunday afternoons (unless it happens to be a 3-day weekend; in which case it could be posted on Monday).


