


In our article July 13th, 2014 we warned that a "significant decline is coming to the stock market." In that article we presented evidence of several Bearish divergences we were tracking between prices and key indicators for our subscribers at www.technicalindicatorindex.com.
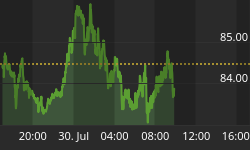
The Industrials topped on July 17th at 17,151. Since that top, four days after our article was published here, the Industrials fell 818 points to 16,333 on Thursday, August 7th. The S&P 500 topped on July 24th at 1,991, and then fell 87 points to 1,904 on August 7th, 2014. As that decline has progressed, volatility has increased sharply. This is excellent for options trading and market timing trading such as we provide in our Platinum Trading program.
The question we want to answer this weekend is, how low does this stock market go, and exactly what is going on here? Is this a major decline starting, with a crash on the way, or is this a correction inside a continuing rising Bull market trend?
To answer this question, we need to get perspective on the big picture for stocks. Stocks are finishing a multi-decade "Jaws of Death" pattern (I dubbed the term for a Megaphone topping pattern in my book, The Coming Economic Ice Age, and get a kick out of the fact that since the book was first published, so many technical analysts are borrowing the term – but I digress). This is a very large pattern, so to determine when precisely it will top is a challenge. Below we show the chart of this pattern.

The above pattern is telling us stocks are getting close to completion of this pattern and the start of a major decline that leads to an economic depression. But there is a pattern that is large (not as large as the Jaws of Death, but rather a sub-component pattern within the Jaws of Death), that gives us a more microscopic view of when a top will be in of major significance. The pattern is a Rising Bearish Wedge from October 2013.

This Rising Wedge needs five major legs or waves to be finished. Each of those five waves has to have three subwaves. It looks to us that the first three of the five waves are complete, that the third, wave c-up, finished for the Industrials at the July 17th top, and for the S&P 500 at the July 24th top. This means that what has occurred since those tops is a significant decline, the fourth wave of this Rising Wedge, wave d-down. Wave d-down needs to consist of three subwaves. The first subwave, a-down of d-down, looks to have finished Thursday, August 7th. The second or middle wave for d-down, b-up, looks to have started with Friday's strong (albeit on low volume) rally. The low volume confirms it is corrective, not impulsive. This means it will be muted, and not exceed the highs in July. It is simply working off the oversold condition of the market from the last three weeks' decline. The rebound could take the Industrials toward 16,800ish and the S&P 500 toward 1,960ish. Once this b-up subwave finishes, possibly by the end of August, maybe sooner, then a strong decline, wave c-down of d-down will follow, taking stocks to new lows below the August 7th levels.
But here is an important and key point: This pattern is telling us there is yet another powerful rally coming to the stock market. Wave e-up. That fifth wave is necessary to complete the Rising Bearish Wedge pattern from October 2013. There should be key characteristics to wave e-up. It should come with declining volume, narrowing breadth, and a Bearish divergence between the NYSE cumulative Advance/Decline Line and stock market prices. In other words, the Cumulative A/D line should decline as the Industrials, S&P 500, and NYSE are reaching all-time highs. These highs will come at rarified air, and like a balloon overinflated, once e-up finishes and the Rising Wedge is complete, a massive "pop" in stocks will begin and last several years. That will be the completion of the Jaws of Death pattern and the start of the Coming Economic Ice Age.
There has only been one stock market crash, and it was a mini-crash, over the past 30 years without a Hindenburg Omen being on the clock. All other crashes came with an H.O. on the clock. (We have an article on the Hindenburg Omen at the Guest Articles section at our website at www.technicalindicatorindex.com if you want some history and theory in that precarious stock market condition). That occurred in August 2011. We do not have a Hindenburg Omen at this time, which supports our contention that wave d-down is occurring now, not the start of the next great Bear Market, and that d-down will have a limited downside, and that we are not likely to get a crash and the start of the Economic Ice Age at this time. A better estimate of when the Jaws of Death will top would be sometime in 2015, after wave e-up of the Rising Wedge finishes. That could be a large rally price-wise while internals weaken into its conclusion. For traders, 2014 has been a challenging year, however what all of the above is telling us is that the trading environment is about to improve dramatically, in fact it has already. We do expect a series of stock market crashes during the next great Bear Market.
If you want to track the technical picture for our economy, the stock market and Gold, we can offer you a free 30 day trial subscription to our market forecasting service at www.technicalindicatorindex.com. Simply click on the Free Trial button at the upper right of our website home page. We cover stock markets, economic events, and Gold daily and have Buy / Sell signals we track for stocks, Gold and precious metals.
Do not be satisfied hearing what the market did; learn how to predict what the market is going to do. Join us at www.technicalindicatorindex.com as we study the language of the markets. Markets tell where they are headed. Technical Analysis is the science where we learn and apply the language of the markets. We are currently offering a FREE 30 Day Trial Subscription. Simply go to www.technicalindicatorindex.com and click on the Free Trial button at the upper right of the home page. If you would like to follow us as we analyze precious metals, mining stocks, and major stock market indices around the globe, We prepare daily and expanded weekend reports, and also offer mid-day market updates 2 to 3 times a week for our subscribers. We cover a host of indicators and patterns, and present charts for most major markets in our International and U.S. Market reports.
Dr. McHugh's new book, "The Coming Economic Ice Age, Five Steps to Survive and Prosper," is available at amazon.com at http://tinyurl.com/lypv47v
"Jesus said to them, "I am the bread of life; he who comes to Me
shall not hunger, and he who believes in Me shall never thirst.
For I have come down from heaven,
For this is the will of My Father, that everyone who beholds
the Son and believes in Him, may have eternal life;
and I Myself will raise him up on the last day."
John 6: 35, 38, 40


