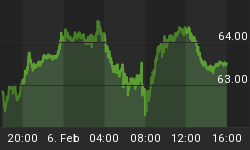
The pattern of trading in precious metals changed for the better this week. After London's bank holiday on Monday, for the first time in a long time the market opened in London's pre-market with higher prices. This indicated Asian or Middle-Eastern physical demand was returning to the market. Predictably, prices drifted lower during London hours as paper trading took over, and all the gains were more or less lost by close of play on Comex in New York.
It was a similar story on Wednesday. Yesterday, (Thursday) started the same way, but this time the move gained more traction; but volumes remain pitifully low, in common with open interest. Today this pattern was not repeated with gold kicking off unchanged on overnight levels. However, gold is up $15 on the week and feels more firmly based.
Measured by deliveries on the Shanghai Gold Exchange, Chinese demand is increasing, with last week's figure rising to 46 tonnes, having increased every week in August. So far this year over 1,200 tonnes have been delivered, and the extension of trading and therefore potential demand into the Free Trade Zone is due to kick off in September.
The chart of the gold price and open interest on Comex is shown below.

August is a notoriously poor trading month, with traders in the northern hemisphere on holiday, or at least not thinking about markets. September is wake-up time, and statistically the best month for gold. Will this be the pattern this year?
Trading in silver continues to be healthier, even if the price performance has been disappointing, with the gold/silver ratio rising to 66 from 63 earlier in the month. Open interest had its first significant fall on Wednesday, when the price rose marginally. This suggests that on balance there is some bear closing in futures. The action is shown in our next chart.

Could this be a harbinger of better times? Quite likely: being mostly an industrial metal, there is some evidence that commercial users are locking in low prices by holding futures positions. Bear in mind that two years ago, users probably estimated silver prices at $35+ in their business plans, so current prices for them are too good to miss.
Quick side-note: palladium continues to power ahead, having made all-time highs consistently in recent months to challenge $900 this week.
PMs and the economic outlook
When it comes to the broader picture, the one chart that says it all is that of the US 10-year Treasury bond.

This is the year when the US economy was supposed to recover: not according to government bond yields. US 10-year Treasury yields slipped this week to 2.33%, and 30-year to 3.08%. The same story is evident elsewhere, notably in the Eurozone and there is only one likely explanation: the advanced economies are on the verge of an economic slump.
This matters for gold and therefore silver, because in such an event opinions are divided over the outcome for prices. Banks, which are after all children of paper currencies and credit, naturally think of government bonds as the safest of safe havens. However, in the event of a global slump, we can expect central banks to expand money supply as much as may be required to stop asset prices falling. This transfers systemic risk from the banking system into currencies, leaving gold and silver as the safest of safe havens.
Next week
Monday. Japan: Vehicle Sales. Eurozone: manufacturing PMI. UK: BoE Mortgage Approvals, Consumer Credit, M4 Money Supply.
Tuesday. Eurozone: PPI. US: manufacturing PMI, Construction Spending, ISM Manufacturing.
Wednesday. Eurozone: Composite PMI, Services PMI, GDP (2nd est.), Retail Trade. US: Factory Orders, Vehicle Sales.
Thursday. UK: BoE Base Rate. Eurozone: ECB Deposit Rate. US: ADP Employment Survey, Initial Claims, Non-Farm Productivity, Trade balance, Unit Labour Costs, ISM Non-Manufacturing.
Friday. Japan: Leading Indicator. US: Non-Farm Payrolls, Private Payrolls, Unemployment.


