• 1,051 days Will The ECB Continue To Hike Rates?
  • 1,051 days Forbes: Aramco Remains Largest Company In The Middle East
  • 1,053 days Caltech Scientists Succesfully Beam Back Solar Power From Space
  • 1,453 days Could Crypto Overtake Traditional Investment?
  • 1,457 days Americans Still Quitting Jobs At Record Pace
  • 1,459 days FinTech Startups Tapping VC Money for ‘Immigrant Banking’
  • 1,462 days Is The Dollar Too Strong?
  • 1,463 days Big Tech Disappoints Investors on Earnings Calls
  • 1,464 days Fear And Celebration On Twitter as Musk Takes The Reins
  • 1,465 days China Is Quietly Trying To Distance Itself From Russia
  • 1,466 days Tech and Internet Giants’ Earnings In Focus After Netflix’s Stinker
  • 1,469 days Crypto Investors Won Big In 2021
  • 1,470 days The ‘Metaverse’ Economy Could be Worth $13 Trillion By 2030
  • 1,471 days Food Prices Are Skyrocketing As Putin’s War Persists
  • 1,473 days Pentagon Resignations Illustrate Our ‘Commercial’ Defense Dilemma
  • 1,473 days US Banks Shrug off Nearly $15 Billion In Russian Write-Offs
  • 1,476 days Cannabis Stocks in Holding Pattern Despite Positive Momentum
  • 1,477 days Is Musk A Bastion Of Free Speech Or Will His Absolutist Stance Backfire?
  • 1,477 days Two ETFs That Could Hedge Against Extreme Market Volatility
  • 1,479 days Are NFTs About To Take Over Gaming?
Another Retail Giant Bites The Dust

Another Retail Giant Bites The Dust

Forever 21 filed for Chapter…

Is The Bull Market On Its Last Legs?

Is The Bull Market On Its Last Legs?

This aging bull market may…

  1. Home
  2. Markets
  3. Other

GOLD and FTSE100 Intraday: Elliott Wave Analysis

On Gold we were tracking a five wave fall last week from 1296 that might have already found a bottom and complete the pattern at latest low that we see it as fifth wave. As such, recovery may extend much higher in this week, especially if we get an impulsive rally back to 1296. In that case we will turn bullish on gold for a larger degree.

GOLD 1h Elliott Wave Analysis

GOLD 1-Hour Elliott Wave Analysis Chart

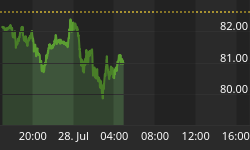
FTSE100 is making a pullback now as rally from August lows appears to be a completed five wave move. The reasons recently more support line that suggests a minimum three wave set-back to former wave iv. Stocks in UK are down because of Scottish referendum so we may see some negative divergence compared to US markets.

FTSE100 1h Elliott Wave Analysis

FTSE100 1-Hour Elliott Wave Analysis Chart


Back to homepage

Leave a comment

Leave a comment