• 939 days Will The ECB Continue To Hike Rates?
  • 939 days Forbes: Aramco Remains Largest Company In The Middle East
  • 941 days Caltech Scientists Succesfully Beam Back Solar Power From Space
  • 1,341 days Could Crypto Overtake Traditional Investment?
  • 1,346 days Americans Still Quitting Jobs At Record Pace
  • 1,348 days FinTech Startups Tapping VC Money for ‘Immigrant Banking’
  • 1,351 days Is The Dollar Too Strong?
  • 1,351 days Big Tech Disappoints Investors on Earnings Calls
  • 1,352 days Fear And Celebration On Twitter as Musk Takes The Reins
  • 1,354 days China Is Quietly Trying To Distance Itself From Russia
  • 1,354 days Tech and Internet Giants’ Earnings In Focus After Netflix’s Stinker
  • 1,358 days Crypto Investors Won Big In 2021
  • 1,358 days The ‘Metaverse’ Economy Could be Worth $13 Trillion By 2030
  • 1,359 days Food Prices Are Skyrocketing As Putin’s War Persists
  • 1,361 days Pentagon Resignations Illustrate Our ‘Commercial’ Defense Dilemma
  • 1,362 days US Banks Shrug off Nearly $15 Billion In Russian Write-Offs
  • 1,365 days Cannabis Stocks in Holding Pattern Despite Positive Momentum
  • 1,366 days Is Musk A Bastion Of Free Speech Or Will His Absolutist Stance Backfire?
  • 1,366 days Two ETFs That Could Hedge Against Extreme Market Volatility
  • 1,368 days Are NFTs About To Take Over Gaming?
  1. Home
  2. Markets
  3. Other

Elliott Wave Analysis For Crude OIL and SP500 Intraday

Energy markets are trading lower today with crude oil at the lows as our complex fourth wave transformed into a triangle and not a zigzag. As such, current leg down is already wave (v) that can be targeting 78.00 in sessions ahead, but 81.23 must stay in place, otherwise count will become invalid.

Crude Oil (Dec 2014) 1h Elliott Wave Analysis

Crude Oil (Dec 2014) 1-Hour Elliott Wave Analysis Chart

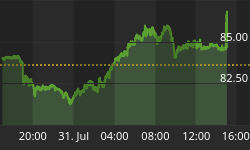
The US markets are falling, following the bearish pattern that we have seen during whole Europe today. German DAX lost more than 250 points today while the S&P futures came down more than 20 points from Friday highs. We see corrections in play on stocks now, On the S&P we anticipate a three wave set-back before uptrend may resume again. Current price is weakening in wave (a) so be aware of more sideways or even bearish price action. Ideally we will see 1920 tested before uptrend comes back in play.

S&P500 (Dec 2014) 1h Elliott Wave Analysis

S&P500 (Dec 2014) 1-Hour Elliott Wave Analysis Chart


Subscribe Our Newsletter If you already haven't >> http://goo.gl/8QVevl


Back to homepage

Leave a comment

Leave a comment