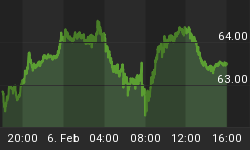
The seasonalities for the metals stock and oil sector turn up in August and already the market is showing signs of improvement. Last month we took at a look at the parabolic structure of the oil price graph. It was duly noted that what provided oil's upward impetus was the fact that the price of oil had to break out from a parabolic dome (see previous commentary, "Crude oil and the dollar test the channels").
We made note that the most recent peak in the oil price was to the right-of-center of the dome pattern, which from the standpoint of parabolic analysis meant that the dome was destined to be broken to the upside since the peak was beyond the "vertex" of the dome with the $64/barrel area (or slightly higher) identified as the most likely conservative upside target based on momentum considerations. This test of $64 was on Monday as crude oil closed precisely at this level. After a possible pullback and brief consolidation it wouldn't be surprising to see the crude price move even higher above $64 this month, which is typically marked by advances in the more sensitive commodities.

As previously mentioned here, August tends to be a bullish month for the XAU gold/silver sector and to natural resource stocks in general. Already the XAU index shows signs of turning up as the month progresses based on the bullish pattern unfolding in its 30/60/90-day moving averages. This dominant short-term moving average series is useful for following the trends of the XAU, especially at pivotal turning points when an old downtrend is exhausting and giving way to a developing uptrend.

Seasonal considerations aside, another reason to expect a firming market for natural resource stocks in the near term is the relentless rise of the Fed funds interest rate. Although the rationale behind the Fed's raising of the rate is supposed to be anti-inflationary, in reality it actually helps to create inflation (as one noted economist has pointed out). So with the upswing in interest rates, it should come as no surprise that the inflation-sensitive stocks and commodities rise in response to it.
Placer Dome (PDG) is one gold stock to keep an eye on in the weeks ahead. It has been a laggard among the blue chip gold stocks of late but may finally be gathering strength for breakout attempt above its July high at $16.00. Providing support for PDG in recent days has been the 60-day MA, which is close to crossing above the 90-day MA. What PDG lacks in relative strength and forward momentum it could make up for in a gradual turnaround attempt in the weeks ahead.


