


U.S. stocks posted a fourth straight week of increases but ended Friday little changed as losses in healthcare shares offset gains in energy. The S&P 500, which hasn't made a 1 percent move this month, is now up 10.4 percent for the year. For the week, the Dow and S&P 500 rose 0.4 percent and the Nasdaq climbed 1.2 percent. The updated year-to-date performance chart below has Treasury bonds as far-and-away the best performing asset class while precious metals have been atrocious.

Recent weekly commentary said "...The S&P 500 has been hitting all-time highs over the past few weeks as the index has risen more than 9% since the middle of October when the market fell into correction territory. Now upward momentum is decelerating as the S&P 500 is getting overbought...Most probably the S&P 500 will stabilize to absorb recent gains and settle into a trading range before resuming a trend higher or lower..." The updated chart below confirms our previous analysis as the price is current at the overbought point where prices usually pullback. Already resistance is holding the S&P 500 index in check while bullish momentum is eroding.

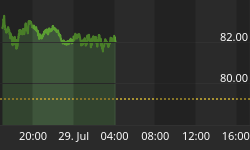
Last week we observed "... the dollar weakened at the end of last week commodity prices immediately strengthened. The dollar should not be expected to remain at an extreme lofty level and if it falls look for commodities prices to recover..." In the updated chart below the dollar stabilized last week this held the Treasury and Gold advance in check.

Market Outlook
So far in the fourth-quarter risk-off' categories that benefit from low inflation and are considered 'safe bets' continue to be market leaders. A good sign for equities is the small cap Russell 2000 index providing good results.

Recently we pointed out "...Money managers have gotten back into the market and pushed stocks to lofty levels, as the market becomes more overbought expect the trend to convert to range-bound trading..." The updated Momentum Factor ETF (MTUM) below highlights stocks current overbought level which should inhibit upward price movement. Expect a price breakout from the current tight trading range, decelerating long momentum noted in the chart suggests a probable downside breakout.

Notice in the one-week CBOE Volatility Index (VIX) graph below the indicator is beginning to creep higher as investors get a little nervous with stocks at lofty levels. A lot of smart investors are taking advantage of the opportunity to purchase inexpensive VIX options to protect portfolio gains.

Recent analysis is developing as advertised with the American Association of Individual Investor Survey (AAII) survey bullish percentage below continuing to move towards an excessive level at the expense of the bearish number, which is extremely low. If inflated bullishness continues over the next few weeks the contrarian interpretation is that should be considered a strong indication of an imminent price pullback. Our near term bet is playing out which is a range-bound trading environment as the market consolidates recent gains.

Third-quarter National Association of Active Investment Managers (NAAIM) exposure index averaged 71.09. Last week the NAAIM exposure index was 77.68%, and the current week's exposure is 85.43%. As seen in the graph below, after falling to all-time lows in the middle of October the NAAIM index has climbed back up to its highest percentage since beginning of June. As we pointed out last week "...This suggests that money managers are becoming fully invested and any near term overall market gains will be incremental..." Also, Michael James, managing director of equity trading at Wedbush Securities in Los Angeles said "most portfolio managers are lagging the indices and there are going to be some aggressive efforts to make up for performance in the next six weeks. Those that are under invested are going to want to be more invested"


Trading Strategy
Biotech stocks were among biggest decliners in the S&P health care index, which fell 0.8 percent and was the biggest drag on the S&P 500. As we mentioned last week "...The Health Care sector has been one of the best performers recently, but is starting to fall after the U.S. Supreme Court agreed to hear a challenge to a key part of the Obamacare health law that, if successful, would limit the availability of federal health insurance subsidies for millions of Americans...Industrials have been coming on strong over the past month..." The biggest change from recent weeks is the plunge in the Utilities sector which had been leading the market. This suggests that traders are looking to accept riskier assets at the expense of dumping risk adverse assets like Utility stocks.

Regards,


