• 619 days Will The ECB Continue To Hike Rates?
  • 619 days Forbes: Aramco Remains Largest Company In The Middle East
  • 621 days Caltech Scientists Succesfully Beam Back Solar Power From Space
  • 1,021 days Could Crypto Overtake Traditional Investment?
  • 1,026 days Americans Still Quitting Jobs At Record Pace
  • 1,028 days FinTech Startups Tapping VC Money for ‘Immigrant Banking’
  • 1,031 days Is The Dollar Too Strong?
  • 1,031 days Big Tech Disappoints Investors on Earnings Calls
  • 1,032 days Fear And Celebration On Twitter as Musk Takes The Reins
  • 1,034 days China Is Quietly Trying To Distance Itself From Russia
  • 1,034 days Tech and Internet Giants’ Earnings In Focus After Netflix’s Stinker
  • 1,038 days Crypto Investors Won Big In 2021
  • 1,038 days The ‘Metaverse’ Economy Could be Worth $13 Trillion By 2030
  • 1,039 days Food Prices Are Skyrocketing As Putin’s War Persists
  • 1,041 days Pentagon Resignations Illustrate Our ‘Commercial’ Defense Dilemma
  • 1,042 days US Banks Shrug off Nearly $15 Billion In Russian Write-Offs
  • 1,045 days Cannabis Stocks in Holding Pattern Despite Positive Momentum
  • 1,046 days Is Musk A Bastion Of Free Speech Or Will His Absolutist Stance Backfire?
  • 1,046 days Two ETFs That Could Hedge Against Extreme Market Volatility
  • 1,048 days Are NFTs About To Take Over Gaming?
Tesla Struggles To Compete In European Market

Tesla Struggles To Compete In European Market

Tesla continues to catch the…

Strong U.S. Dollar Weighs On Blue Chip Earnings

Strong U.S. Dollar Weighs On Blue Chip Earnings

Earnings season is well underway,…

  1. Home
  2. Markets
  3. Other

Alert Condition: Take a Careful Look at this SP500 Chart

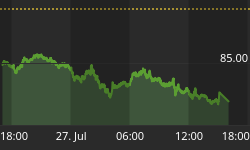
Today's updated chart shows the percentage of S&P 500 stocks with a 20 day C-RSI at a positive or negative level.

When you look at the chart, note that it made a lower/high, and then started moving lower.

Here is the important thing right now ... If this 20 day C-RSI percentage now continues to fall and goes below the 33.4% level made on December 16th. (Marker 185 on this chart.), then that would confirm a down trend, and the market would follow accordingly.

percentage of S&P 500 stocks with a 20 day C-RSI at a positive or negative level


Back to homepage

Leave a comment

Leave a comment