• 842 days Will The ECB Continue To Hike Rates?
  • 843 days Forbes: Aramco Remains Largest Company In The Middle East
  • 844 days Caltech Scientists Succesfully Beam Back Solar Power From Space
  • 1,244 days Could Crypto Overtake Traditional Investment?
  • 1,249 days Americans Still Quitting Jobs At Record Pace
  • 1,251 days FinTech Startups Tapping VC Money for ‘Immigrant Banking’
  • 1,254 days Is The Dollar Too Strong?
  • 1,254 days Big Tech Disappoints Investors on Earnings Calls
  • 1,255 days Fear And Celebration On Twitter as Musk Takes The Reins
  • 1,257 days China Is Quietly Trying To Distance Itself From Russia
  • 1,257 days Tech and Internet Giants’ Earnings In Focus After Netflix’s Stinker
  • 1,261 days Crypto Investors Won Big In 2021
  • 1,261 days The ‘Metaverse’ Economy Could be Worth $13 Trillion By 2030
  • 1,262 days Food Prices Are Skyrocketing As Putin’s War Persists
  • 1,264 days Pentagon Resignations Illustrate Our ‘Commercial’ Defense Dilemma
  • 1,265 days US Banks Shrug off Nearly $15 Billion In Russian Write-Offs
  • 1,268 days Cannabis Stocks in Holding Pattern Despite Positive Momentum
  • 1,269 days Is Musk A Bastion Of Free Speech Or Will His Absolutist Stance Backfire?
  • 1,269 days Two ETFs That Could Hedge Against Extreme Market Volatility
  • 1,271 days Are NFTs About To Take Over Gaming?
  1. Home
  2. Markets
  3. Other

GOLD and WTI Crude OIL Intraday: Elliott Wave Analysis

Gold is slightly lower from this morning, but not much. We see limited downside as pullback seems to be only short-lived. We are talking about red wave iv) that can re-test 1200/1205 support region. So ideally uptrend will resume in sessions ahead.

GOLD 1h Elliott Wave Analysis

GOLD 1-Hour Elliott Wave Analysis Chart

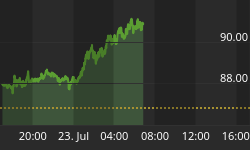
WTI Crude Oil is now trading above the fast downward channel that represents wave iii, so seems like this leg down is finished. However, current bounce can be short-term, as we are looking at wave iv that has a nice resistance coming in around 50 level; at upper channel and 38.2% Fib. retracement zone.

Crude Oil (Feb 2015) 1h Elliott Wave Analysis

Crude Oil (Feb 2015) 1-Hour Elliott Wave Analysis Chart


Back to homepage

Leave a comment

Leave a comment