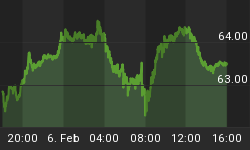
UPDATED: Take a careful look at today's S&P 500 chart ...
Today's updated chart shows the percentage of S&P 500 stocks with a 20 day RSI at a positive or negative level. (Remember that, on a standard RSI indicator, it is really Neutral when the RSI is at a level of 50. Above 50 would be a positive and below 50 would be a negative.)
Here is the important thing right now ... This 20 day RSI percentage is now moving up which is a short term positive, but the down trending (lower/highs and lower/lows) that has occurred since November 21st. must be broken or the market will be facing high downside risks.
About the chart: The numbers at the bottom run from 1 to 211. Each number represents one trading day, so the current tick is at day 200 and it represents the most recent trading day which was yesterday. The percentage numbers on the left hand column are the RSI readings below 50% would be a negative level and above 50% would be a positive level.


