


Originally published February, 9, 2015.
All three major indexes registered strong gains for the week, with the Dow industrials rising 3.8 percent for its biggest weekly gain since January 2013. Nonfarm payrolls increased more than expected in January and wages rebounded, while employment numbers for November and December were revised sharply higher, the U.S. Labor Department reported. The unemployment rate ticked up to 5.7 percent as a result of an increased labor force. After the report, traders added to bets that the U.S. central bank will start to hike interest rates by midyear.
As evidenced in the graph below, gold started the year on fire and treasures were bullish as well. Equities had a down January and most of the major indexes only broke above breakeven this past week. You can see that gold and treasuries are falling back to earth and if this trend continues stock indexes will keep moving higher.

A tool to help confirm the overall market trend is the Bullish Percent Index (BPI). The Bullish Index is a popular market "breadth" indicator used to gauge the internal strength/weakness of the market. It is the number of stocks in an index (or sector) that have point & figure buy signals relative to the total number of stocks that comprise the index (or sector). So essentially it is the percentage of stocks that have buy signals. Like many of the market internal indicators, it is used both to confirm a move in the market and as a non-confirmation and therefore divergence indication. If the market is strong and moving up, the BPI should also be moving higher as more and more stocks are purchased.
This past week the benchmark S&P 500 index posted 43 new 52-week highs and two new lows; the Nasdaq Composite recorded 99 new highs and 26 new lows. Last week we stated, "...the current chart shows the breakout failed and converted into a tight trading range. The question is whether the break out of the trading range will be to the upside or downside..." As highlighted in the chart below the S&P 500 Bullish Percent Index is breaking out of a trading range to the upside. The index needs to continue moving higher next week to confirm the breakout.

Contrary to the other major Bullish Percentage Indexes, the Nasdaq Composite BPI has been stuck in a tight trading range the past three weeks. This reflects conflicting earnings results among Nasdaq companies where some had stellar numbers, but others were disappointing.

Note in the updated chart below that gold and treasury bonds have fallen off from high levels while the dollar remains strong. We have pointed out recently how it is unusual for all three asset classes to simultaneously trade at stratospheric prices. The dollar remains strong as the currency of last resort during global economic uncertainty. Treasuries and gold are higher because of worries about the stock market. However, last week's economic data alleviated some concerns about the U.S. economy and investors sold off treasuries and gold.

Market Outlook
As of Friday, with 64% of the S&P big-cap companies having reported, earnings are expected to show a 6.4% year-over-year gain, with revenue up 1.8%. So far, 72% have beat analysts' profit estimates and just 17.1% missed, says Thomson Reuters. Since 1993, typically 63% beat, in the past four quarters, 69% did. The S&P healthcare and technology did even better, with 88% of both sectors beating estimates.
Technology profits are on track for a 17.3% gain, nearly double the 8.9% expected back on January 1st. Revenue is likely to rise 9%, more than double estimates. But most of that reflects blowout results from just one company - Apple. For its fiscal Q1 ended Dec. 27, the tech titan earned $3.06 a share, up 48%, with net income of $18 billion. Sales soared 30% to $74.6 billion, its best gain in 11 quarters, as 74.5 million iPhones sold. Excluding Apple, tech earnings are up 8.8% and sales 4%. For the S&P 499, profits should rise just 4.4% and sales 1.2%. Take away Apple, and the entire S&P 500 grew profit just 4.4% instead of 6.4%, said Thomson Reuters, blending those that have reported already with estimates for the balance.
So far in the first quarter of the year, Real Estate, Treasury Bonds and Gold are far and away the top asset classes. For most of the quarter investors have expressed skepticism about the strength of the equity market and have been parking funds in what they view to be safer assets.

Last week we pointed out "...As reported by the Stock Barometer, in pre-election years, February's performance generally improves with average returns all turning positive. NASDAQ performs best, gaining an average 2.4% in pre-election-year Februarys since 1971. Russell 2000 is second best, averaging gains of 2.1% since 1979. DJIA, S&P 500 and Russell 1000, the large-cap indices, tend to lag with average advances of around 1.0%. However, February does not have a solid track record when full-month January was negative. Going back to 1950, DJIA has declined 23 times in January, S&P 500 25 times and NASDAQ (since 1971) 15 times. Regardless of index, the following February was down more often than up and the average performance was solidly negative..."

A standard chart that we use to help confirm the overall market trend is the Momentum Factor ETF (MTUM) chart. Momentum Factor ETF is an investment that seeks to track the investment results of an index composed of U.S. large- and mid-capitalization stocks exhibiting relatively higher price momentum. This type of momentum fund is considered a reliable proxy for the general stock market trend. We prefer to use the Heikin-Ashi format to display the Momentum Factor ETF. Heikin-Ashi candlestick charts are designed to filter out volatility in an effort to better capture the true trend.
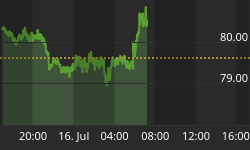
Last week's Momentum Factor ETF (MTUM) chart analysis said, "...The most probable near-term outcome is range-bound trading with triple-digit market fluctuations..." As highlighted in the chart below, this analysis is playing out as advertised. The dotted lines define the current trading range. As noted, the strength and momentum indicators are neutral which supports continued range-bound trading.

Last week we mentioned, "...Volatility is back and may be here to stay. Expect more of it moving forward this year and beyond. As seen in the graph below, the Volatility Index (VIX) and S&P 500 Index crossed last week. The VIX ended higher as the S&P 500 had a down week..." You seen in the updated graph below the VIX dropped off last week as the S&P 500 finished the week higher. Investors are pointing to signs the U.S. economic recovery is on track and are less concerned about a market crash.

As displayed in the graphic below traders have backed off from excessive put buying. Energy prices may have stabilized and strong employment numbers have boosted confidence the U.S. economy is on solid footing, which supports stock prices.

The current American Association of Individual Investor Survey (AAII) survey results approximate its long-term averages. But the bullish estimate dropped substantially from last week which would suggest stocks might finish next week on an up note, even if prices are not substantially higher.

The National Association of Active Investment Managers (NAAIM) Exposure Index represents the average exposure to US Equity markets reported by association members. The green line shows the close of the S&P 500 Total Return Index on the survey date. The purple line depicts a two-week moving average of the NAAIM managers' responses. As the name indicates, the NAAIM Exposure Index provides insight into the actual adjustments active risk managers have made to client accounts over the past two weeks. Fourth-quarter NAAIM exposure index averaged 67.77%. Last week the NAAIM exposure index was 92.62%, and the current week's exposure is 88.24%. Money Managers have upped their equity exposure in response to the recent sell-off in treasury securities and precious metals. Equity exposure can be expected to remain elevated throughout fourth-quarter earning season.


Trading Strategy
The Technology sector has been the biggest surprise during fourth-quarter earnings season. But S&P 500 health care companies are on track for the biggest gains: up 22.5% for earnings and 11.5% for sales. The collapse of crude oil prices over the past six months has sent the energy sector into a tailspin. Energy profit fell about 21.2% in Q4 while revenue plunged 13.7%. Exclude energy -- but include Apple -- and the S&P 500 would be on track for a 9.9% earnings gain and 4.4% revenue rise. The outlook for energy is even more bearish, with analysts anticipating sector earnings falling 61.8% in Q1 and 60.6% in Q2.
Thanks to energy -- and the strong dollar's impact on multinationals -- forecasts are gloomy for the overall S&P 500. Analysts forecast Q1 earnings to slip 1.4% while revenue falls 1.9%. Q2 earnings are expected to grow a meager 0.7% while revenue once again falls 1.9%. "That's really where you see some alarm," said David Aurelio research analyst at Thomson Reuters. "That's all driven by energy."
Analysts expect solid earnings and sales growth in Q1 and Q2 outside of energy. Cheaper fuel also creates winners. Airlines, seeing huge cost savings, are in the industrials sector, which is growing profit 11.9%. Consumer discretionary, including automakers and many retailers, is on track for a 12.7% gain. "Oil's pain is somebody else's gain," said Sheraz Mian at Zacks Investment Research.
Financials also felt the pain in Q4 as most big banks struggled amid a stronger dollar, big legal costs and weaker trading revenue. Their earnings likely will show a 1.6% drop.

Feel free to contact me with questions,


