Great rushes of market euphoria have inevitably been followed by sudden loss of bids, overall liquidity, as well as the discovery that financial concerns have displaced celebration.
Naturally, early symptoms of such fateful transitions are worth monitoring.
These include the yield curve flattening with the boom and then reversing to steepening. The U.S. curve is still flattening, but the U.K. curve reversed in July.
Another indicator of change is widening credit quality spreads. For high-yield corporates, the spread, over treasuries, resumed widening at 301 bps on August 2 and so far has reached 315 bps. Through 320 bps would lock in the trend towards concerning conditions.
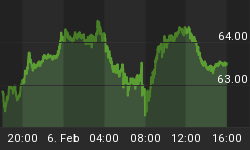
One of the more interesting such indicators is not widely followed. At times, the gold/silver ratio seems to act like a credit spread in anticipating or confirming a boom by decreasing, or the same for contraction in increasing.
The ratio increased to 81 in June, 2003 and, as it reversed, it confirmed that the boom would soar. The chart follows and the main thing is the decline to 55 on June 1 (the spike-down to 51 in 2004 seems anomalous in the context of this discussion).
However, since early June the ratio has had a significant recovery and today's swoon in silver popped it above resistance at 64 to 65.5. Technically, this is breaking out of a reverse "head and shoulders" pattern which is opposite to that at the top in 2003.
At this stage of speculative euphoria, typically its exhaustion is signaled by dramatic plunges in silver relative to gold.
This seems to be starting and it is worth noting that currently Brazilian and Indonesian credit spreads have been widening. The latter reminds of the Asian Crisis that started with the Thai baht on July 1, 1997.
Buying of lower grade credits has been ambitious, if not reckless. On August 18, the Wall Street Journal headlined "Binge in Purchases of Corporate Debt". There has been similar buying of low-grade emerging debt bonds.
At times of almost relentless euphoria in lower grade bonds, it is worth reviewing the consequences of previous examples.


