


- The rally from the 2009 low is aged
- The risk that price is reaching a Major Top is getting high
- SPX has a potential ending pattern in progress.
- On Friday we had a reversal candlestick in the Internet ETF (FDN): high beta names like FB, GOOGL, LNKD, TWTR and IWM, while XLE remains weak, but we need to see real weakness in SPX and NDX in order to adopt a bearish stance.
- Breadth is overbought (NYSE Summation Index)
Monthly time frame:
- The month of February ends with an impressive performance
- There is nothing bearish in this time frame
- As long as we don't have a monthly close below the 10 ma which today stands at 2004 the trend remains firmly up

- However as I have already mentioned in previous updates monthly oscillators are flashing warnings
- RSI has breached the trend line support off the 2009 low and it is displaying a negative divergence
- Stochastic has a bearish cross in force since December
- MACD is testing the signal cross

Weekly time frame:
- The three-day losing streak has printed a Shooting Star, but the internal price action is doubtful hence as long as SPX remains above the support zone (Range 2094-2085) I would not rule out another up leg with a target at the blue trend line which next week will stand at 2137 +/-
- If the support zone is violated then we have two target zones: Target 1 = 2072-2062 (5 & 10 wma); Target 2 = 2043 (Rising 20 wma)

- Weekly oscillators are bullish in spite of the negative divergence of the RSI (In force since July 1014), both the Stochastic (Which is overbought) and the MACD have a bullish signal cross. Probably if the MACD signal cross is not erased the potential forthcoming pullback will only retrace a "tranche" of the rally from the February low

- SPX could be forming an Ending Diagonal (Ending pattern):

Daily time frame:
- The three-day losing streak has resulted in the first eod print below the 10 dma since the kickoff of the February upleg. It could be a warning sign that a larger pullback is underway if next Monday the support at 2012 is breached.
- If a pullback is in progress we have four target zones:
- Range 2093-2085
- Rising 20 dma which today stands at 2078
- Range 2072-2064
- Rising 50 dma = 2056
- If the 50 dma does not hold the risk of a Major Top would substantially increase

- Daily oscillators are wearing: RSI(5) has breached its accelerated trend line from the January 30 low, if the trend line off the February low does not hold it will probably drop into oversold territory; The Stochastic has a bearish signal cross. If it crosses the 80 line a larger pullback will be most likely confirmed

60 min time frame:
- There is still no real technical damage despite price has breached the accelerated trend line from the February 9 lod and it has closed below the 50 ma.
- Price action is choppy (Not impulsive) but if 2102 does not hold odds would favor a quick drop to the support zone 2093-2085
- If 2085 is breached a larger pullback would be underway with an initial target at the 0.382 retracement = 2066

- However since the current decline is not impulsive the 3 day decline could be setting a bear trap, since there still two potential short-term bullish setups:
a) Bullish Flag: The current decline can be the second wave (B) of a Double Zig Zag (In addition it could be forming a Bullish Flag). If this is the case the rally from the February low will end after another upleg that could reach the 2130 area.

b) Triangle: If next Monday Friday's lod holds, we could have a bullish Triangle wave (B) with a measured target for the following thrust wave (Y) at 2127, which should conclude the rally from the February low:

- The bearish case would be a gap down next Monday. A potential Head & Shoulder has a target at 2088, probably it would kick-off a larger pullback, although the end of the rally from the February low would have been achieved with a questionable Ending Diagonal.

What are Breadth Indicators suggesting?
- The Weekly Stochastic of the Summation Index is overbought. The risk of a bearish signal cross is high. When a bearish signal cross is triggered usually it opens the door to several weeks of weakness before another buy setup occurs

- However the NYSE Tick Cumulative so far remains above its 10 dma (signal line)

- Next Monday we have to monitor the McClellan Oscillator if it remains above the zero line (A s/t bullish outcome would be possible) or it dips below the zero line in which case bearish would regain the upper hand

As I mentioned at the beginning of this update on Friday we had a potential reversal of the FDN ETF. Internet and Social Media stocks have a high beta and usually lead the market in a rally. If they stumble it could be a sign that bullish things are about to change:

Also IWM has a potential reversal candlestick (Shooting Star) that is threatening to break down a Rising Wedge. If next Monday the support at 122 does not hold a likely larger pullback would be underway.
On Friday I went short IWM with a stop above Friday's hod.

Going forward we have to closely monitor the following three sectors:
1. Nasdaq Composite: It has been the indisputable leader of the February rally. It is now so extended and overbought hence the risk of a correction is high. In addition the February rally is a thrust following a Triangle. A Triangle occurs prior to the final move within a larger pattern. With this I don't want to be interpreted as a Perma Bear but if a correction is underway most of the February gains would be erased. Probably a drop to the gap fill at 4857 would not be out of the question

2. Financials: We could make the case that XLF has already established a major top on December with an Ending Diagonal. The Rebound from the February low is corrective hence it can be considered a countertrend move

The critical price level is at 24. If/when it is breached the next down leg could be the kick-off of another major down leg

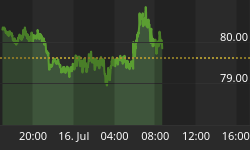
3. Energy Sector: The rally from the January low has been a clear corrective-countertrend move. The two consecutive gaps down off the February 17 high have produced a bearish Island Reversal. XLE it is now trading below the 10 dma and 20 dma. Hence it is a weak and staying weak sector that could drag the equity market down if the gap at 77.86 were closed


