


Opening Whisper - "Too Soon to Tell"
Here's just a quick look at the markets today. Hurricane Katrina has done her damage to the gulf shores, oil platforms and refining operations. From here on, the gulf oil business is in recovery mode. How bad was the damage? Only time will tell. Oil prices pulled back, but natural gas prices did not. The damage continues as the storm moves north. Even though the storm seemed to diminish just slightly before battering New Orleans, the damage could be great and the cost estimates will continue to escalate for days.
TECHNICALS: The broader markets sold down at the start and then put on their smiley face and rallied steadily during the day. The daytime rally could be short-lived or the start of a multi-week rally. The NDX tested the 75 period moving average (on hourly chart). Today's high did not quite make it to the upper line (blue line) on the downward sloping sell channel. See the chart below.
The downward sloping red line is a good place to have our stop going into tomorrow. We entered the sell signal at 1590 on the NDX on August 8. We don't want to let this trade go negative on us, so we will set the stop level at 1590 which just happens to be the location of the SELL signal break-even point.
The story here is that the down-trend since our sell signal on Aug. 8 is not broken. A move above 1580 would break out of the channel, but we should hold until the 1590 level is breached on a daily close before we go to cash.

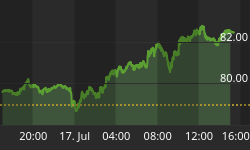
The Last Month - Hourly Chart - NDX
On the daily chart (next page), the NDX has not yet touched the middle of the Bollinger Bands. The NDX must break through the mid-point to get another rally going. My prediction... (Oooopps, no predictions! - We are trend followers, not trend predictors.) My "analysis" is that a rally will be in full swing if the mid-point of the BB is topped. That mid-point is just below the magic 1590 mark.
SENTIMENT: The VIX and $CPC were down today, but their upward trends were not materially changed.
Trend Following Philosophy: One of the basic tenants of our trend following approach is that we must always find the new trend. We did that successfully on August 5-8. At that time, the upward trend channel was broken. Positive (bullish) sentiment was damaged. The weekly stochastic had reached the oversold mark (80 level) for a second "bump" at the top.
Today's market reaction was one in which we could have let our emotions get the best of us. But our money-making system requires that we listen carefully to what the PRICE is telling us. And today price was telling us that nothing unusual happened. The price is well-contained in the SELL price channel. We must always be asking ourselves this question; "What would it take for us to discern with some probability, that the current trend has been broken?"
(Trend Following Philosophy - continued)
There are several ways to do this. These include;
- Where are we in relation to the location of the current signal entry point?
- Look at the shorter and longer period charts (60 min, daily, weekly, monthly).
- Look at the 50, 100, and 200 day moving averages on the daily charts.
- Look at the Bollinger Bands on the daily charts. Are we at an upper/lower band?
- Look at the current trend channels. Have we broken out?
- What is sentiment doing? Has it reached an extreme?
- Have the "standard" indicators been at extremes on the weekly and monthly charts?
- What is Volume doing?
Today, volume was very light. Using the trend turn forensic techniques above, the trend channel is not yet broken, but we should hold our signal entry point or admit defeat.

6 Month Daily Chart - NDX
Market Listener Trend Timing Signal Summary Current Signal: 100% SELL (Bought RYVNX Rydex Venture 100 Fund) Subscribers were advised by email of the SELL signal before the close on Monday Aug. 8. Fault Tolerant Cash Safety Stop - For August 30 and the rest of the week, exit to cash (RYMXX) on a daily close of NDX above 1590. |
I am working on the art of listening and hope that you are also.
Best Profits,


