


Gold has been very weak during the first two weeks in March. Bulls could not defend the $1,200/1,190 level and consequently the market sold off down to a recent low around $1,146. The expected recovery never happened. The main driver remains the unprecedented US-Dollar strength. Despite any short-term moves Gold is in a clearly defined downtrend and should find its final low somewhere between $980-$1,035 likely in May 2015. If we don't get down to this level the bear market will probably extend for another year.
Mines & Money Mauritius 2015
I have been invited to speak at the Mines & Money Mauritius Conference in June 2015 again. If you would like to join you can receive 25% off your delegate pass by using my discount code MP995SPK.

Midas Touch Gold Summary
During the last two weeks the model remained in sell mode. Gold Volatility as well as the HUI Goldbugs daily chart have moved to a new sell signal, while Gold Sentiment is now flashing a contrarian buy signal. The model sums up to -11 meaning the sell mode is intensifying. If Gold moves above $1,209 we will get a buy signal on the daily chart and the confirmation that some form of a recovery is on the way.

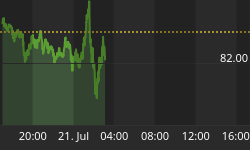
Gold Daily Chart
Gold broke through the important support level at $1,180 and once again confirmed the descending bearish triangle formation which is developing since nearly two years now. This time the breakthrough below $1,180 is more decisive and does not look like the bear trap we got last November. On Friday Gold bounced off the lows around $1,149 for the third time making some form of a recovery possible. But the Slow Stochastic has just embedded again. Therefore the downtrend is locked in even stronger. On the positive side there is only the RSI indicator reaching oversold levels and Gold in general is oversold now. Either Gold can stage a recovery towards at least $1,180, maybe $1,200 and unlikely until $1,240 starting next week or Gold will directly test the November low at $1,130 before any recovery towards $1,180 could happen. Overall the downtrend is in place and I feel like $1,130 and later $1,050 will be acting as a strong magnet.
The most promising strategy in my eyes is simply to wait until May/June for the final bottom in Gold and the Gold stocks. Then and only by then the markt should present a wonderful contrarian entry setup.
Traders should be very careful here. Gold is oversold and can bounce any minute but this oversold status can remain much longer as well. Due to the fact that the overall trend is still clearly down I'd only be looking for a good entry to short this market in the next couple of weeks. Any recovery towards $1,200 or $1,240 would present a reasonable risk/reward-ratio.
Investors have been able to accumulate physical Gold below $1,200 in last 10 days. I recommend to now lower the buy limit down to below $1,150 and continue to accumulate into weakness until you hold 10-20% of your net-worth in physical Gold and Silver as an insurance.
Long-term personal view
The return of the precious metals secular bull market is moving step by step closer and should lead to the final parabolic phase (could start in summer 2015 or 2016 and last for 2-5 years or even longer).
Before this can start Gold will need a final selloff down to $1,050-$980.
Long-term price target DowJones/Gold-Ratio remains around 1:1.
Long-term price target Gold/Silver-Ratio remains around 10:1 (for every ounce of gold there are 9 ounces of silver mined, historically the ratio was at 15:1 during the roman empire).
Long-term price target for Gold remains at US$5,000 to US$8,900 per ounce within the next 5-8 years.
Fundamentally, as soon as the current bear market is over Gold should start the final 3rd phase of this long-term secular bull market. 1st stage saw the miners closing their hedge books, the 2nd stage continuously presented us news about institutions and central banks buying or repatriating gold. The coming 3rd and finally parabolic stage will end in the distribution to small inexperienced new traders & investors who will be subject to blind greed and frenzied panic.


