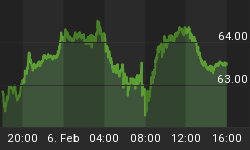
Best reading of the cycles suggests yields ended a cycle on 1/30 (1.650%). Then we saw a rally to 2.259% which we have labelled as wave (W). It can be sub-divided as a WXY Elliott wave structure when wave Y only managed to reach 0.618 ext of W-X. We have seen a WXY drop in blue wave (X) to just below 123.6 ext of W-X and reaction from the lows is beginning to suggest that cycle from (W) peak is over and wave (X) should be in place at 1.852%. As this level holds, yields are expected to continue the rally. Levels of interest on the upside would be 2.227 followed by 2.46 - 2.604% area.
If you would like to have an access of EWF analysis in real time, click here and feel free to join us. We provide Elliott Wave charts in 4 different time frames, 2 live webinars by our expert analysts every day, 24 hour chat room support, market overview, daily and weekly technical videos and much more.


