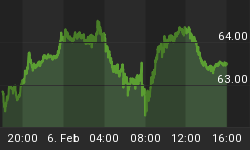
In this video we take a look at FTSE decline from the recent peak which visually looks to be a 5 wave move. We dissect the price action and show the viewer’s why we don't see the decline as a 5 wave move and rather as a triple three (w)-(x)-(y)-(z) structure.
If you would like to have an access of EWF analysis in real time, click here and feel free to join us. We provide Elliott Wave charts in 4 different time frames, 2 live webinars by our expert analysts every day, 24 hour chat room support, market overview, daily and weekly technical videos and much more.


