


Wall Street stocks ended the day higher this past Friday, snapping a four-day losing streak as traders shrugged off weaker-than-expected US economic growth in the fourth quarter. US stocks fell the first four days of the week on worries about the crisis in Yemen and excessive equity valuations. "We had so many down days that the market is due for some sort of a pause, but there is nothing really positive or encouraging to help push prices meaningfully higher," said Sam Stovall, chief investment strategist at S&P Capital IQ.
Stocks fell most of the week due to a combination of weaker-than-expected economic data and concerns that the rapid rise of the dollar may crimp U.S. corporate earnings. Companies start releasing their first-quarter results next month. The four consecutive days of losses made last week the second-worst week for the market so far this year. The Dow Jones industrial average remains down slightly for 2015, and the S&P 500 index is essentially flat.

In the chart below you can see that the Dow Jones Industrial Average and Dow Transportation index have diverged from each other. Observe how normally these two indexes move in synch to confirm the trend. If the Transportation index does not catch up to the DJIA, that is considered a bad sign for the strength of any bullish move.

A tool to help confirm the overall market trend is the Bullish Percent Index (BPI). The Bullish Index is a popular market "breadth" indicator used to gauge the internal strength/weakness of the market. It is the number of stocks in an index (or sector) that have point & figure buy signals relative to the total number of stocks that comprise the index (or sector). So essentially it is the percentage of stocks that have buy signals. Like many of the market internal indicators, it is used both to confirm a move in the market and as a non-confirmation and therefore divergence indication. If the market is strong and moving up, the BPI should also be moving higher as more and more stocks are purchased.
At indicated in the chart below, Nasdaq stocks are in their first serious downtrend since the beginning of the year. These shares had been overbought for a long time and were overdue for a pullback. Most of the bloodletting in technology stocks is probably ending and prices should stabilize prior to earnings season in a few weeks.

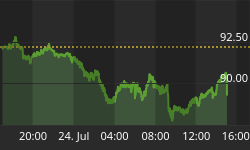
Treasury bonds (TLT) continue to trend bullish, even with a pullback over the past few days. With recent geopolitical events reminding everyone that everyplace in the world is not safe and economic growth is tepid at best, TLT should eventually continue its rally. The dollar (UUP) has pulled back following its huge rally, but similar to TLT; this pullback is most likely due to profit taking. Nothing has changed so dramatically as to fundamentally alter the bullish trends in TLT and UUP. Commodities continue to struggle, even with recent strength in gold (GLD) the past few days, which is most likely due to geopolitics, not to a change in the global economic outlook. Economic indicators are showing the U.S. economy to be on pace for its poorest showing since 2008. Going forward, profits and growth will probably be the investors' chief concerns.
Last week we said "...The U.S dollar maintains its inverse relationship to commodity assets...you can the dollar's recent pullback corresponded to a bounce in treasury securities and precious metals. Last week the dollar was off 1.5 percent against a basket of major currencies..." The dollar and treasuries intersected for the first time since the middle of February. If the dollar remains under pressure expect treasury bonds and gold to intertwine over the next few weeks.

Market Outlook
The question is whether the U.S. economy is really slowing down or whether the phenomenon can be blamed on the nasty winter weather. In addition to first-quarter earnings reports, investors will also be watching the Labor Department's monthly job markets survey, due out April 3, for insight into how the economy is doing. "I'm trying to be as forward-looking as possible here. Clearly the weather had some sort of impact this quarter, but I still believe U.S. economic growth is strong," said Scott Wren, a global equity strategist at Wells Fargo Advisors.
Last week we commented "...The Federal Reserve Open Market Committee committed to near-term lower interest rates, which catapulted rate sensitive assets like real estate and treasury bonds..." Smaller capitalization equity indexes are the leading stock performers for the first quarter. The companies comprising these indexes generate most of their sales and earnings from the domestic market, which is showing steady improvement. Larger firms rely more on overseas economies where there are questions about future growth.

A standard chart that we use to help confirm the overall market trend is the Momentum Factor ETF (MTUM) chart. Momentum Factor ETF is an investment that seeks to track the investment results of an index composed of U.S. large- and mid-capitalization stocks exhibiting relatively higher price momentum. This type of momentum fund is considered a reliable proxy for the general stock market trend. We prefer to use the Heikin-Ashi format to display the Momentum Factor ETF. Heikin-Ashi candlestick charts are designed to filter out volatility in an effort to better capture the true trend.
Recent Momentum Factor ETF (MTUM) chart analysis said, "...Don't be surprised if prices stall next week because stocks have become overbought..." The updated chart below confirms stocks current downtrend. Now it appears the market is at a support level where prices should move back up.

The Volatility Index bounced higher off its support level following four consecutive days of stock losses that ended on Friday. If the market does not follow through on Friday's modest gains look for the VIX and S&P to intersect due to higher volatility.

The current Put/Call ratio indicates traders are betting on near-term range-bound stock prices. Investors are basically buying equal numbers of calls and puts to position for whichever direction stock prices move.

The current American Association of Individual Investors (AAII) Sentiment Survey supports near term range-bound trading. Bullish sentiment approximates the long term average. Retail investors are leaning heavily toward neutral trading and moved away from the bearish reading.


The National Association of Active Investment Managers (NAAIM) Exposure Index represents the average exposure to US Equity markets reported by association members. The green line shows the close of the S&P 500 Total Return Index on the survey date. The purple line depicts a two-week moving average of the NAAIM managers' responses. As the name indicates, the NAAIM Exposure Index provides insight into the actual adjustments active risk managers have made to client accounts over the past two weeks. Fourth-quarter NAAIM exposure index averaged 67.77%. Last week the NAAIM exposure index was 67.77%, and the current week's exposure is 84.32%. Money Managers are doing a sector rotation and putting stocks on the books to display for end of quarter reporting.


Trading Strategy
With the major stock indexes falling to neutral readings and economic indicators struggling, options traders should continue to evenly weight between bullish and bearish positions. Fed-generated momentum could continue to push stocks higher, but slowing growth and geopolitical events could cause the market to do an about-face very quickly.
As evidenced in the graph below, the past month has been a wholesale slaughter for most of the S&P sectors. The only group to barely survive the onslaught is the Healthcare sector. Right now money managers are implementing the end-of-quarter sector rotation to position their portfolios for what they perceive will be the best performing investments over the next six months. Healthcare has been a leading S&P sector the past few months and right now is the only group in positive territory over the past month. You want to have some exposure to healthcare, plus financial and cyclical stocks as well. It is probably a good time to consider bidding on shares you have on your watch lists that are now reasonably prices.

Your trading success is not unlike other parts of life in that sometimes, timing is what really matters most. We recently bet on Biogen to close below $445 last week. Technically and fundamentally, this was a textbook setup for a profitable trade. However as noted in the chart below, the company issued a surprise overnight pronouncement about promising results from a new drug to treat Alzheimer's. Insiders who knew about the news ahead of time started bidding up the price the day before. The price soared in overnight futures the day before the news and the stock gapped up almost 10% at the start of trading on the day of the announcement. As evidenced in the chart, insiders started taking their profits almost immediately and Biogen closed last week lower than before news about the Alzheimer drug leaked out. The end result is not going to put the funds back in our account, but it appears to confirm the analysis used to setup the trade was valid. Unfortunately, unless you are well connected it is difficult to factor in the timing of news releases as a component in trade analysis. This is exactly why we prefer to avoid executing trades into known earnings bulletins or other news, it tends to increase volatility i.e. risks associated with the trade.

Feel free to contact me with questions,


