


I have been tracking the idea of a possible ending diagonal since Jan 2015 we turned bullish at the Feb 2015 lows, with most of the world looking for the dreaded 3rd of 3rd and a crash, we at wavepatterntraders stood firm in our analysis and was looking for new all time highs.
SPX

As the squeeze pushed higher, slowly we saw the bears capitulate and the bulls come out and start dancing again. Once we saw the new all time high it was back to being bearish for us again, so as we faded the bearish crowd at the Feb 2015 lows, we again faded the bullish crowd at the Feb 2015 highs.

We have been bearish from the Feb 2015 highs, although I am now questioning the decline, as the move really appears to be corrective move and reminds me of the same sort of decline we saw into the Feb 2015 lows. If it's actually part of a move that is going to accelerate lower, it would need to see a strong break under 2030-40SPX, failure to see that would suggest the current decline could be a possible 4th wave of an alternative ending diagonal.

Alternative view
Although this time we now have a possible setup that could see a strong decline lower should the support area at 2030-40SPX give out. If the decline proves to be corrective and buyers support the market around 2030-40SPX then I favor the bulls could take the market back up and squeeze the bears one more time to make a new all time high. The area around 2030-2040SPX is a big decision maker for both ideas, as we still don't have a clear cut trend we are going to take both ideas into next week and let the market help us decide its path.

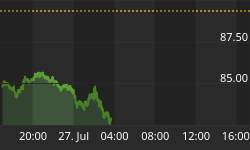
USDJPY
One clue may still come from the USDJPY pair, as most traders know the US markets and this pair have a very high correlation, if this pair still has a date with a new yearly high it could be a clue to suggest the SPX sees a new yearly high as well. The bulls on both the SPX and USDJPY need to step up soon and stop this current decline. A strong break above 119.85 would help the bullish case.


Déjà vu NDX
The NDX maybe tracking a similar fractal to the Feb 2015 lows, if this fractal is going play out and we do see a new yearly high, it then needs to see buyers around at the support band, failure to find buyers could be a very ominous sign and potentially suggest a peak is now in place and the last swing high ended an ending diagonal. Next week should prove to be an exciting week; sooner or later we are going to get a resolution to the current trend.

Decision time is upon us.

Interested in following and trading our ideas? Sign up here and make sure you are trading on the right side of the market. For $22.50 a month will get you access to our ideas.
Until next time,
Have a profitable week ahead.


