


SPX
We went into last week with two ideas, with the bearish crowd proclaiming a crash was due once 2040SPX had been broken, it seems the majority of traders were just too bearish, low and behold as if by magic the magic hand comes to the rescue and supports the market in Globex. The move last week supports the idea now that the market is likely going to make a new all time highs for wave 5 of an ending diagonal, that's the preferred idea now, although we could see a small pullback, staying above 2060SPX helps the bullish case and target new highs towards 2125-40SPX.


The prior idea I was using, is not technically invalid, it's just the fact the last week don't really support the idea of a major decline from these levels, I would much prefer to see new all time highs from here. Its then I would then start to slip back into the bear suit again. Currently it don't really offer a strong bullish or bearish setup, the bears really need to see it make a new all time high to complete its current pattern, ideally then we see the bulls all come out and sing kumbaya. If this pattern is correct, then its setting up for a large decline as it's a pattern that is seen in the terminal stages of a trend. It still needs a bit more upside, if we do see a new all time high we will be looking to fade the bullish crowd and look for a large decline.
Cycle timing
I am not one for cycles, they seem to come and go, but this chart does stand out as something that could suggest some caution for the bulls, that and the suspected ending diagonal pattern I think is a combination that the bulls maybe want to at least acknowledge.

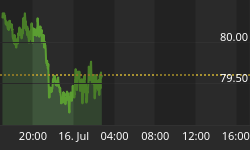
US$ aka DXY
The US$ has been on a rampage the past few months, however we think the current trend is likely close to a reversal and setting up for a large decline. I suspect the current move is in wave 5 (alt idea is some variation of a corrective pattern for wave 4 such as a triangle). By staying above 98.00 supports the case for more upside and new yearly highs, we want to be watching for a strong RSI divergence, that will also support the idea of a 5th wave and potentially the trend that started from last May is coming to a termination.

One way to play a move lower in the US$ is to buy UDN, this is basically a mirror image of the EURUSD, but this is a cheaper way to play a trend move, if we are correct on the US$ and the US stock markets are coming to the end of the trend that started from the Oct 2011 lows, then both these trends will be macro trend moves, that we will be seeing a multi-month corrections, so ideal for swing traders.

Until next time,
Have a profitable week ahead.


