


From now on, I'm including silver in my updates. There are important issues on the horizon that will involve silver to a greater degree. One of those issues is: J.P. Morgan is accumulating physical silver like there's no tomorrow; another is: silver is important and sensitive to commodity price changes as well as a hedge against adversity (gold is a better hedge against adversity than silver, but silver is coming into the forefront for other reasons, which we will look at in the coming updates).
Last time I wrote, the stock market as measured by the S&P 500 had just had a serious one day plunge down to 2072 on April 17. I wrote that I believed that the majority of analysts were wrong about their assertion that we were beginning the long awaited correction and that we were instead likely to see all time highs this past week into the low 2120's. On Thursday and Friday, the S&P 500 tried to get above the 2120/21 zone with no success as the posted high on Friday was 2120.92.
One would think that this last move was terminal or that we might breakthrough to vast new highs. I don't think either is going to happen. My cycle/wave analysis suggests that we pull back to around 2190 by FED day April 29th and then rally into May 5th to about 2121/22, ...THEN... we crack.
How hard? Looking at the charts, I'm expecting a 5.1% pull back into May 14th and that is about 2007/08 on the S&P 500. Earlier on, I was suggesting we would see perhaps a move down to 1935, but I no longer think that projection is viable. Even with the Utilities cracking and the Transports lagging and the Dow Industrials not confirming and the NASDAQ rallying to new recovery highs with just Microsoft, Google, Amazon and Starbucks leading the charge Friday and the breadth stinking to high heaven, I don't think it plausible at this point and that is amazing! In the past, these kinds of readings would have caused the market to fall 10% (even 20%) in a short space of time!
So what now? Well, if the astro/cycle projection is correct, we are in the same cycle (or close) as we were in late November coming into early December. We had Saturn making a sesquiquadrate to Uranus on Dec 3, 2014 and now again on May 4th. We also have Jupiter squaring the Full Moon on May 5th, which points to a silver bottom on April 29 (like Dec 1, 2014) and a top in the stock market on May 5th (like Dec 5th). Back then, the SPX made a low 43 trading days after the previous 20 week low on October 15, 2015. The last 20 week low was March 11, 2014 and it looks like a bottom on May 14th this time, or 45 trading days after the 20 week low.
If all things remain the same and silver bottoms near the last low on Dec 1, 2014, we could see silver rally into the end of June, and the same rally into the end of May that we had in the stock market from Dec 16 to 29. It could be a rinse and repeat cycle with higher highs into late July preceded by a choppy June.
Of course, this whole forecast (like a weather forecast) may need to be revised (or not). It remains to be seen. But this I know, this kind of market behavior cannot go on forever. And I know this, silver is in a bear market regardless of what J.P. Morgan is doing. I believe we see lower prices on silver into the fall, as well as a probable bear market in stocks coming soon.
So, my current forecast suggests a continued, slightly, upwardly tilted bullish stock market with choppy behavior into July (the bulls and bears continuing to duke it out with a slight advantage for the bulls). Silver is still in a bear market, but a bear rally is imminent into June.
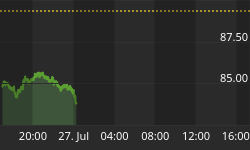
Below are charts of the S&P 500 and Silver:


So, there you have it! I hope you read about the Chinese Yuan coming into currency reserve status in October, because it is going to cause havoc to the US dollar and our economy in the future. I've said it before and I'll say it again, "this is no longer a buy and hold stock market, but a traders market".
The BluStar Market Timer gained 53.5% from April 1, 2014 to March 31, 2015 as timed by Timer Trac. The subscription web site is http://www.blustarmarkettimer.info. Brad Gudgeon, Editor of the BluStar Market Timer, is a market veteran of over 30 years. Copyright 2015 BluStar Market Timer. All rights reserved.


