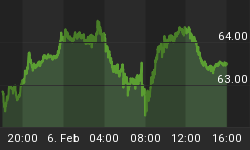
The last 2 updates proved to be incorrect due to whipsaw action. This kind of market frequently follows late, forced breakouts from triangles, and should have been anticipated. In the case of silver, the price ran right into the apex of its triangle, which suggests market manipulation. Silver is an extreme situation - we had a false downside breakout about a week ago, which was followed by a quick recovery, and we still have no resolution. Gold, however, at least on its price chart, appears to be gathering strength.
The correct way to handle a market such as this, which wants to play rough, and engage in whipsaw action, is to temporarily desist from using trendlines and minor support/resistance levels and automatically trade overbought/oversold conditions, switch to using longer-term weekly charts to keep a perspective on the big picture, and to broaden the parameters used to establish whether a breakout is genuine. If this market wants to move the goal posts, then we'll move with them.
Gold has started to look more bullish over the past couple of weeks, despite the still bearish COT figures. However, we know from experience that it's a mug's game to trade against the COTs. The dollar looks close to completing a normal reaction back to fairly strong support in the vicinity of its now rising 200-day moving average, following its strong rise earlier in the year, and this could be the reason for the gold COTs continuing to look bearish.


We can see gold's price improvement on the 5-year weekly chart, with it pushing up towards important resistance at the 2004 highs, and the MACD indicator looking bullish. However, it has spent a lot of time now flip-flopping around in this trading range with the result that it has broken its long-term uptrend, albeit marginally, and needs to break above its 2004 highs soon to avert the risk of a more serious retreat.
While gold's long-term trendline break may be so far classed as marginal, the same cannot be said of the dollar, which decisively broke out of its long-term downtrend earlier in the year with a powerful upwave. Although the dollar looks to be in ragged retreat on shorter-term charts, on the 5-year weekly chart shown here the recent retreat, which was accurately predicted, appears to be nothing more than a normal corrective reaction to the upwave that preceded it, and with the dollar nearing rather strong support around 85 in the vicinity of its now rising 200-day moving average, the reason why the Commercials are heavily short gold at this time becomes increasingly clear. The strong rally in the dollar earlier in the year did look like an impulse wave, meaning a move in the direction of the larger trend. If it was there are 2 possibilities. One is that the dollar is in a new bull market, which is viewed as unlikely. The other possibility is that the dollar is in the process of making a 3-wave A-B-C correction to the long-term downtrend. If this is the case - and this is viewed as the most likely scenario - then the dollar will turn up again soon, possibly after dropping a little more into the support around 85, and advance strongly, taking out the resistance in the 90.5 - 92.5 zone, before pushing on towards the next strong resistance zone towards 100, where the entire countertrend move would be expected to terminate. A dollar advance of this magnitude, even though it would not kill off the long-term bull market in gold, would obviously not be good for gold and gold stocks on an intermediate basis, as gold's support in the $400 - $420 area would be expected to fail, leading to a drop to the next strong support in the $365 - $385 area, where the entire corrective phase, mirroring the countertrend upward move in the dollar, would be expected to end.
If the dollar's strong advance earlier in the year was not, as suspected, an impulse wave, then we must consider the dollar to be currently in a large trading range bounded by support at the 2004 low at about 81 and the resistance at 90 - 92.
To avert the risk of gold going into a deeper corrective phase, it needs to break clear above its 2004 highs at about $455 soon now, this would imply that the dollar's support in the 85 area will fail.

The gold COTs remain bearish, with a high Large Spec long position and a high Commercial short position, although the figures are not as extreme as they were at the start of the month.


