


The good news is:
• There was no build up of new lows in spite of three consecutivedown days for most of the major indices.
Most of the major indices moved slightly downward last week and took most of the short and intermediate term indicators with them.
The NASDAQ new high indicator ( OTC NH) is a 10% trend (19 day EMA) of NASDAQ new highs. Its direction, not level is a good short term indicator. The chart below shows the NASDAQ composite (OTC) in red and OTC NH in green, dashed vertical lines are drawn on the first trading day of each month. The OTC NH turned downward last week. The strength on Friday was only enough to arrest the decline that began earlier in the week, not turn the indicator upward.

Summation indices (SI) are running totals of oscillator values.
The chart below shows the OTC in red, OTC AD SI calculated from NASDAQ advancing issues - declining issues, OTC HL SI calculated from NASDAQ new highs - new lows and OTC UD SI calculated from NASDAQ upside - downside volume. When all of the SI's are headed in the same direction it is imprudent to bet against them. Last week all of the NASADAQ SI's turned downward as well as SI's for most sectors.

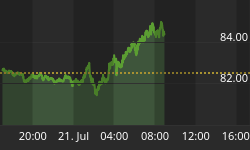
Gold, Utilities and Telecom are the only sectors showing any real strength.
The chart below shows the Dow Jones Utility Average (DJU) in red and SI's calculated from the component issues of the DJU. New highs and new lows were calculated over the trailing 6 weeks rather than 52 weeks as reported by the exchanges. All of the DJU SI's are heading sharply upward.

The table below shows daily returns for the week following options and futures expiration during the 1st year of the Presidential cycle. Data for SPX covers the period from 1929 and for OTC from 1965. There are summaries for all years 1963 - 2004 for the OTC and 1928 - 2004 for the S&P500 (SPX).
Options and futures were not an issue prior to the mid 80's and then more important to the SPX than the OTC. If options are a factor their effect has been mixed. In the past 20 years during the 1st year of the Presidential cycle the SPX has been up 40% of the time which is better than the overall average of 21% for all presidential 1st years since 1929. The OTC has been a little better, up 60% of the time, but with a modestly negative return.
The number following the year is the position in the presidential cycle. Daily returns from Monday to Friday during the week following options and futures expiration.
| OTC Presidential Year 1 | ||||||
| Year | Mon | Tue | Wed | Thur | Fri | Totals |
| 1965-1 | 0.30% | 0.26% | -0.22% | 0.26% | -0.69% | -0.09% |
| 1969-1 | 0.40% | 0.41% | 0.77% | -0.17% | -0.27% | 1.14% |
| 1973-1 | 0.21% | 0.10% | 0.75% | 0.59% | -0.06% | 1.58% |
| 1977-1 | -0.39% | -0.12% | -0.47% | -0.29% | 0.10% | -1.17% |
| 1981-1 | 0.08% | -0.62% | -1.78% | 0.22% | -2.92% | -5.03% |
| 1985-1 | 0.05% | -0.69% | -0.81% | -0.57% | 0.00% | -2.03% |
| Avg | 0.07% | -0.18% | -0.31% | -0.04% | -0.79% | -1.10% |
| 1989-1 | -0.15% | 0.03% | -0.07% | 0.06% | 0.23% | 0.11% |
| 1993-1 | 0.01% | -0.90% | 1.63% | 0.90% | 0.32% | 1.97% |
| 1997-1 | 0.54% | 0.47% | -0.59% | -0.50% | 0.20% | 0.11% |
| 2001-1 | -1.22% | 0.80% | 2.00% | 1.04% | 0.50% | 3.12% |
| Avg | -0.20% | 0.10% | 0.74% | 0.38% | 0.31% | 1.33% |
| OTC summary for Presidential year 1 1965 - 2001 | ||||||
| Avg | -0.02% | -0.03% | 0.12% | 0.15% | -0.29% | -0.03% |
| Win% | 70% | 60% | 40% | 60% | 56% | 60% |
| OTC summary for all years 1963 - 2004 | ||||||
| Avg | -0.24% | 0.02% | 0.14% | -0.35% | -0.18% | -0.60% |
| Win% | 38% | 55% | 59% | 36% | 51% | 43% |
| SPX Presidential Year 1 | ||||||
| Year | Mon | Tue | Wed | Thur | Fri | Totals |
| 1929-1 | -0.03% | -1.85% | 0.16% | 0.91% | 0.00% | -0.81% |
| 1933-1 | -0.90% | 0.36% | -3.17% | -2.00% | 0.00% | -5.71% |
| 1937-1 | -1.62% | 1.00% | 0.43% | -2.48% | 0.00% | -2.67% |
| 1941-1 | 0.29% | 0.39% | -0.68% | -1.27% | 0.00% | -1.26% |
| 1945-1 | -0.06% | 0.13% | -0.06% | -0.38% | 0.00% | -0.38% |
| Avg | -0.47% | 0.01% | -0.66% | -1.04% | 0.00% | -2.17% |
| 1949-1 | -0.70% | -2.32% | 1.45% | 0.58% | 0.45% | -0.53% |
| 1953-1 | -0.31% | 1.40% | 0.13% | 0.04% | 0.26% | 1.52% |
| 1957-1 | -2.29% | 0.68% | -1.21% | 0.26% | -0.05% | -2.61% |
| 1961-1 | -0.65% | -0.79% | 0.42% | 0.04% | -0.40% | -1.38% |
| 1965-1 | 0.03% | -0.30% | 0.46% | -0.40% | 0.18% | -0.03% |
| Avg | -0.78% | -0.27% | 0.25% | 0.11% | 0.09% | -0.60% |
| 1969-1 | 0.46% | 0.00% | -0.14% | -0.76% | -0.64% | -1.08% |
| 1973-1 | 0.15% | 0.64% | 0.72% | 0.23% | -0.60% | 1.15% |
| 1977-1 | -0.65% | 0.04% | -0.82% | -0.01% | -0.05% | -1.50% |
| 1981-1 | 0.84% | -0.48% | -0.88% | -0.55% | -1.95% | -3.02% |
| 1985-1 | 0.44% | -0.91% | -1.07% | 0.35% | 0.00% | -1.20% |
| Avg | 0.25% | -0.18% | -0.44% | -0.15% | -0.81% | -1.13% |
| 1989-1 | 0.48% | -0.05% | -0.02% | -0.22% | 0.39% | 0.58% |
| 1993-1 | -0.82% | -0.46% | 0.72% | 0.34% | -0.02% | -0.25% |
| 1997-1 | 0.52% | -0.37% | -0.78% | -0.70% | 0.78% | -0.55% |
| 2001-1 | -0.23% | 1.23% | 1.99% | -0.25% | 0.16% | 2.91% |
| Avg | -0.01% | 0.09% | 0.48% | -0.21% | 0.33% | 0.67% |
| SPX Summary for Presidential year 1 1929 - 2001 | ||||||
| Avg | -0.27% | -0.09% | -0.12% | -0.33% | -0.11% | -0.89% |
| Win% | 42% | 50% | 47% | 42% | 46% | 21% |
| SPX summary for all years 1928 - 2004 | ||||||
| Avg | -0.40% | 0.25% | 0.08% | -0.31% | -0.19% | -0.51% |
| Win% | 36% | 59% | 55% | 37% | 41% | 42% |
During the past week the market turned modestly downward and seasonally next week has a negative bias.
I expect the major indices to be lower on Friday September 23 than they were on Friday September 16.
This report is free to anyone who wants it, so please tell your friends. If it is not for you, reply with REMOVE in the subject line.
Last weeks positive forecast was a miss, all of the major indices were down less than 1%, but down. My expectation that seasonal strength would keep the market moving upward for another week was overly optimistic.


