


Opening Whisper
... Barry and Helga marched on with venom in their voices, their signs held high. Being a part of this cadre of anti-nuclear pals gave purpose to their lives. They felt like leaders and were humbled that others had followed their call to live a life of candle power, solar energy and stationary bicycle generators to power their internet campaigns and communications.....
- From "Lights Out", a 3-sentence novel, by Greg Miller ;^)
There are going to be a lot of cold homes in the US this winter. How did we get into this mess? Where are the additional refineries and spare capacity? When will we have the LNG off-loading facilities to meet our gas-fueled needs for shipping in more BTU's from the Middle-East? Where is the energy leadership in this country? This is a matter of national security. Don't blame Rita or Katrina. They were simply messengers.
For decades governmental policies have piggy-backed taxes on gasoline sales assuming the gravy train would never end. No need to plan for the future. Just transfer the projected problem to the next congress and the next generation. I suspect some of you know that this will likely end badly. Or will it just deteriorate gradually. Ahhhh, what's a mere 100% increase in heating oil and natural gas bills here or there? For those of us who are blessed to be above the poverty line, we might just survive a few such increases. Others, not so fortunate, will pay a much dearer price. But there is only one long term answer. Nuclear, or "nucular" if you prefer.
*************************************************************************
SPECIAL ANNOUNCEMENT: To All Market Listeners
Sorry, we are no longer accepting free subscriptions. We are graduating to a fee-based subscription service as of November 1, 2005. Look for details of an exclusive one-time subscription rate only for current Market Listeners. To receive this ONE-TIME discounted rate for Market Listeners you must send an email to: subscribe@MarketListener.com and type "OFFER" in the subject block. The special rate will not be publicly available after October 31 st. We will send you an email with all of the subscription details.
*************************************************************************
In the next few years, the markets will be progressively tied to the energy fallout. It's not just the pricing of energy, but the lack of it, and the ensuing conservation that will impact everything. But increased pricing will also have its effect on that two-thirds of the US economy,…. households. Watch thoughtfully as the energy rhetoric heats up in the next year leading to the November 2006 elections. Please contact your congressional representatives and US senators regarding your thoughts. We must increase our nuclear dependence. Any simplistic review of the energy use growth projections will demand a more limitless source, based on our shores, and powering our electric autos. We are 12-15 years away from a mostly nuclear-electric economy if we start today.
For the purposes of this newsletter and our trading signals, there must be a long term view for economic slowdown or even recession. Within that 2-4 year perspective we will pounce on the inevitable rallies and declines, profiting as we can in a shorter term cyclic fashion.
And then there is the bird flu hazard. Next week, hopefully we'll have some good news. I'm holding my breath with fingers crossed. The monthly US jobs number comes out next Friday. I doubt that the markets will like the negative numbers.
This Newsletter is provided to those who are interested in looking for an alternative to the "buy & hold" investing mentality. This information is not intended as trading advice. It is intended for your information and education only. You should consult a Financial Adviser before attempting any trading strategy.
TECHNICALS: Most of the major indices were up more that 1% on the week with the exception of the big-money OEX. In a kingdom of blind people a one-eyed man is King! And in a flat market since July, 1% seems to be a huge move. The NDX out-paced the other indices with a 1.90% gain on the week. The relative strength of the NDX is nothing more than a yawner. We need to see continued strength in NDX before it gives us that breakout indication which leads the charge which could bring the broader market into a year-ending rally. It is not there yet.
This week I took another look at a long term OEX chart (S&P 100 - Up 0.80% on the week). I find it hard to believe that the market is ready to move higher when I take in the big picture from this chart. Look at the "Price Relative to SPX" at the bottom of the chart. The OEX has lagged the SPX consistently since May 2003. Extremely long-term traders could use the 50 and 8 EMA lines on this weekly chart as a long term buy or sell signal. The OEX would have to rally significantly here to avoid generating a sell signal in the next couple of months.
The RSI on the OEX has been sticking to the 50% level, another indication (if you needed it) that these largest cap stocks are range-bound. The 575 level has provided multi-year resistance for the OEX. I could get very bullish on the markets if the OEX busts through 585 with some relative strength that surpasses the S&P 500, i.e. if the "Price Relative" at the bottom of this chart began turning upwards. My conclusion is that the OEX is giving us a long term alert that we are getting close to judgment day for the US stock market. On any hard break below 550, and should the 8 EMA weekly line dip below the 50 EMA line, we might see many institutional sellers pile on.

3 Year Weekly Chart of S&P 100 (OEX)
TREND FOLLOWING COMPLIANCE: The NDX gained back what it lost last week. We are now back to the 1600 level where we were on Sept 16. I can't call that a trend in either direction. Our Sell signal compliance was foiled this week with the advance in the NDX. We have basically lost our current trend.
The relative strength of the Nasdaq Composite vs. S&P 500 is shown in the chart below. This chart ratio has turned up, but we experienced a similar turn in January 2005. That relative strength turn did nothing to stem the selling over the next 3 months. Will we experience a similar selling phenomenon into year end? This chart is telling us that the Nasdaq Composite is leading stocks lower over the last 2 months. The big turn upward in this ratio, which would precede a year-end rally, needs some more big technology power to really get it going.

1 Year Nasdaq Composite / SPX Ratio
Our Fault Tolerant Cash Safety Stop is calculated to be 37 points, but that doesn't matter since the market moved against us this week and our stop remains at 1610, unchanged from last week. The NDX closed the week at 1601. Today an email was sent to subscribers before the close to alert them that we breeched our Early Exit point at 1590. We therefore exited 50% of our short position (RYVNX). We are still holding a 50% position in RYVNX Venture 100.
Subscribers will receive an email with instructions and a revised trailing stop level if the market sells off sharply next week. Market Listener discounted subscriptions will be available until October 31 . For details send an email to: subscribe@MarketListener.com with "OFFER" in the subject line.
RISK ASSESSMENT: There is still considerable risk of a downside move if we are correct that the rally of the last week has been due to the window dressing of Wall Street's portfolios. Our stop level of 1610 could be hit quickly next week. A strong move of NDX through 1610 would generate a BUY signal. A weak turn upward would take us to cash only. Stay with us.
Our Trading System - What The Numbers Are Telling Us
The whip-sawing of our positions continues. During these times of losing trades, the best thing we can do is to take a big step back and look at the longer term picture. Our faster optimized MACD parameters have not helped us grow our profits. Let's take a look at what the weekly charts are telling us, since the daily indicators have been inconclusive. But before we look at our model chart, let's take a look at the Nasdaq High-Low chart below.

1 Year Daily - Nasdaq New Highs-New Lows ($NAHL)
This chart tells us that the NH-NL's have been in a downtrend for 2 months. But this week the indicator turned higher and busted out above the 20 and 70 EMA lines. Is this a breakout or a fakeout? We should know next week. If this week's rally fails to continue next week, then this indicator should resume its downturn. As you can see we are not anywhere near the capitulation which was seen in this indicator in mid-April of this year. Also watch that MACD (32-56-25). A cross of the signal line has been a good buy/sell signal this year.
This week I have substituted an SPX chart as our model. Why? Because we have been faked out recently by the NDX high beta moves down and up which have given us several false signals. It would be normal for the markets to produce these gyrations when it is fighting to keep its head above water. Are we at a long-term top? Is the death of stocks near? Probably not, but it's time to look at the broader market using our old faithful weekly model.

SPX - 6 Month Weekly Chart Model - Friday Sep 30, 2005
Here we see that the indicators are mixed. The Slow Stochastic has just this week given us a Sell signal while the faster StochRSI is signaling a Buy. Both MACD's are indicating weak Sell signals. Volume has increased in the last 3 weeks. Now here's another idea to take away from the above chart. Look at the candlestick highs for the last 4 weeks. What do you see? We are seeing lower highs for the last 3 weeks even though this week was an "up" week. My conclusion from this SPX chart is that we are still in a market SELL mode. NDX must bust above 1615 and SPX must break out above 1245 to generate a raging bull BUY signal. Failure to do so will confirm a Sell.
What About Gold? - The gold miners had a good week with NEM, $XAU and $HUI being up more than 3%. These stocks look like a continuing Buy. If you are on board, you must continue to ride them, but I would warn against new entries into this volatile small cap market. This week Gold (up 1.9%) lagged the miners. This could be a warning sign that the miners may be getting too much buying exuberance and could be taken down a notch.
The US dollar index (chart below) is now in overbought territory and it may be ready for a pull-back. This could lend some more short term support for the gold rush.

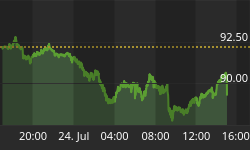
1 Year Daily $USD Dollar Index
What Is The Current Market Sentiment?
This week's rally was foretold by last week's $CPC spike above 1.4. In hindsight, we should have bought the spike, but then we would be day-trading instead of trend timing. However, take a close look at the $CPC for this week. Here we can see in the chart a down spike and an oversold MACD which may be telling us that we have topped again and that the markets will sell-off next week. Check it out.

6 Month - CBOE Total Put/Call Ratio
Where Do We Go From Here and How To Listen For the Next Signal?
Our indicators and leading sentiment inputs are giving us mixed signals. Our proprietary adaptive indicators are likewise mixed. This leads us to believe that the late week rally was simply some window dressing which may be undone in the next week or two. We need to stick to our 1610 NDX stop level and see what next week brings.
Market Listener Trend Timing Signal Summary Current Signal: 50% SELL (Bought RYVNX Rydex Venture 100 Fund) We will issue an email to subscribers next week if we get a buy signal or have a mid-week update. |

NDX ZigZag Compliance Chart - 5%
ML Signals & Results
| Recent Signal | Slo. Stoch. (fast) | StochRSI (fast) | ROC (fast) | MACD (Variable) | ML Signal3 |
| Sep 15, 2005 | Sell | Sell | - | Buy | Sell |
| Sep 14, 2005 | Sell | Sell | - | Buy | Cash |
| Sep 07, 2005 | Buy | Buy | Sell | Buy (mod.) | Buy |
| Sep 06, 2005 | Buy | Buy | Sell | Neutral | Cash |
| Aug 08, 2005 | Buy- | Buy | Buy | Buy | Sell |
| Aug 04, 2005 | Buy | Buy | Buy | Buy | Cash |
| July 08, 2005 | Sell | Buy | Buy | Buy | Buy |
| June 24, 2005 | Sell | Sell | Sell | Buy- | Cash |
| May 13, 2005 | Buy | Buy | Buy | Sell++ | Buy |
| May 06, 2005 | Buy | Buy | Buy | Sell+ | CASH |
| Feb 11, 2005 | Sell | Sell | Sell | Sell | Sell |
| Feb 04, 2005 | Sell | Cash | Sell | Sell | Cash |
| Jan 14, 2005 | Sell | Sell | Sell | Buy | Sell |
| Dec 31, 2004 | Buy | Buy | Buy | Sell | Cash |
| Aug 27, 2004 | Buy | Buy | Sell | Sell | Buy |
| Aug 20, 2004 | Sell | Buy | Sell+ | Sell | Cash |
| Aug 06, 2004 | Sell | Sell | Sell | Sell | Sell |
3 This Market Listener signal is our base signal. The MACD is our primary weekly input, but can be "out-voted" by the other faster indicators on a daily basis when we need to go to cash to implement our Fault Tolerant Cash Safety Stop (FTCSS). You should not base your trading on this or any other single indicator. Our trend following system dynamically adjusts parameters based on current market conditions including volume and sentiment factors.
With Rydex Dynamic funds, we can trade in the morning and 5 minutes prior to the close during the trading day/week when we see that one or more of the fast signal indicators have changed signals. This is particularly important if we need to go to a CASH position in order to preserve capital. The above table shows the results of the Adaptive System Model Signals.
Listen To What He Says
NAB Isaiah 48:14 "Assemble, all of you, and listen! Who among them has declared these things? The LORD loves him; he will carry out His good pleasure on Babylon, And His arm will be against the Chaldeans. I, even I, have spoken; indeed I have called him, I have brought him, and He will make his ways successful. Come near to Me, listen to this: From the first I have not spoken in secret, From the time it took place, I was there. And now the Lord GOD has sent Me, and His Spirit. Thus says the LORD, your Redeemer, the Holy One of Israel, "I am the LORD your God, who teaches you to profit, Who leads you in the way you should go. If only you had paid attention to My commandments! Then your well-being would have been like a river, And your righteousness like the waves of the sea." (emphasis added)
I am working on the art of listening and hope that you are also.
Best Profits,


