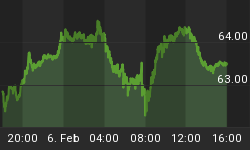
While gold consolidated its recent gains, silver was sold down this week along with other metals and energy. The whole commodity complex suffered badly in the stock-market fall-out, before a sharp bear-squeeze across commodity markets pushed silver, copper and oil sharply higher yesterday (Thursday). Silver is now down 6.8% on the year and gold 5%. Prices were slightly firmer this morning in Asian trade, before the European opening.
Storm-force winds blew through all markets, with substantial falls in equities after last weekend. As it became clear that the falls would be contained for the moment, the US dollar rallied and US Treasury yields increased from the panic lows. This recovery in general sentiment led to weakness in precious metals generally.
The sharp fall in silver is hard to justify in anything other than purely speculative terms. While the last Commitment of Traders Report (18th August) for the US futures market showed Managed Funds short positions were slightly less extreme, they are still very high, as shown in our next chart.

We will get updated COT figures this evening, but it is reasonable to suppose that some of the long positions in this category have been closed with open interest falling about 7,000 contracts. There may have been some producer hedging as well. The net position, longs minus shorts, is our next chart.

The chart confirms speculators in the form of hedge funds were still extremely bearish as a crowd mid-month and there is little evidence this sentiment has changed this week.
Anecdotal reports are of significant shortages of physical gold and silver, despite the negative sentiment in futures markets. Demand for coins and retail bars in the US has cleaned out the dealers, particularly for silver, and in London availability of sovereigns continues to be tight. Western markets for gold in particular must be reflecting the strains imposed upon it by continuing Asian demand, which has led to progressive destocking of vaulted gold for the last three years.
The next chart shows how China's public demand for physical gold, the largest identifiable physical market, has grown over recent years.

In the first seven months of 2015, 1,464 tonnes were taken up by the public, an annual rate of over 2,500 tonnes. If the average monthly growth seen in the first half persists, total deliveries could be somewhat more. World mine production according to the US Geological Survey in 2014 was only 2,860 tonnes, including China's own output of 450 tonnes, putting this one market in context. Other Asian countries are also buyers, notably India which is back in the market for an estimated 1,000 tonnes this year.
These two nations alone are taking out about 150-200 tonnes more than is mined, and while there are also scrap supplies to consider, maybe about 500 tonnes globally, scarce bullion stocks in the west are still being depleted.
The public response throughout Asia to currency instability could be the most important influence on the gold price in coming months. Traditionally, when currencies come under stress the public reaction is to step up gold purchases, in which case backwardations will persist and premiums in Asian markets will rise.
I shall tweet the latest weekly demand figure for China later today when available on @MacleodFinance.
Next week
- Monday. Japan: Capital Spending, Vehicle Sales, Construction Orders, Housing Starts. Eurozone: Flash HICP. US: Chicago PMI.
- Tuesday. Eurozone: Manufacturing PMI, Unemployment. UK: BoE Mortgage Approvals, Net Consumer Credit, Secured Lending, M4 Money Supply. US: Flash Manufacturing PMI, Construction Spending, IBD Consumer Optimism, ISM Manufacturing, Vehicle Sales.
- Wednesday. Eurozone: PPI. US: ADP Employment Survey, Non-Farm Productivity, Unit Labour Costs, Factory Orders.
- Thursday. Eurozone: Composite PMI, Services PMI, ECB Deposit Rate. US: Initial Claims, Trade Balance, ISM Non-Manufacturing.
- Friday. US: Non-farm Payrolls, Private Payrolls, Unemployment.


