



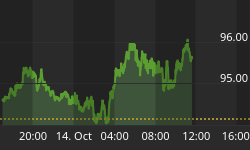


The Dow and S&P 500 have fallen by around 10% since August, which in normal times would be hardly worth mentioning. But below the surface, in what used to be the market's hottest sectors, much more serious damage is taking place.
Biotech, which had an epic bull market during the era of QE and the Affordable Care Act, had begun to crater even before Hillary Clinton proposed price controls for pharmaceuticals. Last week it went straight down.

Solar stocks had a quiet bull market that accompanied the technology's emergence as heir apparent to fossil fuels. But now they're quietly crashing:

Junk bonds, which are essentially the equities of highly-leverage companies (because they turn back into equity when the bonds default and reluctant creditors are forced to take ownership of the junk issuers) have tanked in the past few months and are now far below their 50 and 200-day moving averages.

One group that isn't plunging is the gold miners. But that's mainly because they had their crash while everything else was still rising, and are now at historically cheap levels. Here's an ETF that tracks the junior gold mining stocks:

What does it mean when several high-flying sectors crash all at once? If history is still a reliable guide (a big if in today's manipulated world) it means the internal structure of the market is deteriorating much more quickly than the behavior of the Dow and S&P 500 seem to imply.
When stocks in general catch up to the carnage in yesterday's hot sectors, we'll get something a lot more extreme than a simple correction. And when that happens the odds of the Fed raising US interest rates drop to zero.





