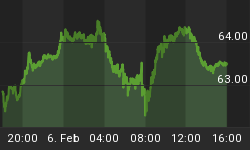
When markets get overly optimistic, meaning too many bulls, they have a tendency to struggle, even if it takes a while before they go down appreciably. See how the market did nothing most of last year except to move laterally. Then we had the strong and powerful move lower that took the Sp down 14%. Now we're dealing with the opposite affect. The bull bears spread now at minus -4.2% which is off last weeks -10% reading but still below 0 which is very good news for the bulls. The Rydex bear fund is also at three year highs which shows you the bears are still quite aggressive which is a negative for them of course. The market has shown a few gap ups here over the past couple of days and may now be headed for a lateral bull flag type of set up. There's no given amount of time it has to stay in the flag but it's in a flag for now and that normally resolves itself from the direction it came from which was up. Add in that bull markets usually tend to test the old highs over and over even if the levels fall a bit shy and it's not out of the question that we'll continue to trend higher overall. Not easily but trend that way. We saw it today as overbought short term charts allowed for yet another move higher in the indexes before encountering resistance at Sp 2000 or the mid point from the recent high to low. They also encountered overbought again with some short term negative divergences. The fall wasn't bearish off the top so I'd say again that it appears the indexes are trying to set up bull flags to work their way higher over time. No guarantee of this of course based on the continuing flow of poor economic news but this is what appears to be setting up in just about every index I look at. Times are a bit better now for the bulls. Nothing special but at least a bit better.
The key level to keep tabs on is the 2,000 area on the SP 500 as we setup in a potential Double Bottom pattern seen below:

For the bull market to continue on further than it already has you'd at least have to start with improving global economies. We are seeing anything but that for the most part, especially here at home over the past few months. Declining manufacturing and services. Declining job creation and the list goes on and on. To make matters worse from a technical perspective, any move to new highs would create massive negative divergences on the monthly index charts across the board. They would be quite sever in nature and that is often how bull markets make their final highs. If the fundamental picture continues to erode and can not help the technical picture I'd say the end is near for the bull market, even if we make a higher high first. I believe that even if the fundamental picture does improve, the bull would still end but the process would take longer to play out. Also, it wouldn't be as severe in price or time. Those nasty monthly charts in the end I believe call a top if we make new highs, or even if we don't. Hopefully we can push thing out until some time later next year but a lot of that depends on the fundamentals and all we can do is see how they come in day by day. Maybe we can get more surprises positive like we did with the euro zone earlier this week. On the other hand, the news out of China is so terrible that it's hard to imagine things turning around bullish any time soon. The early earnings numbers are painting a bad picture for future growth out of China.
The SP 500 similar to the Wilshire 5000 firmed up off our Rising Support Line off the year 2009 lows this week:

The earnings season is upon us now. This scares me for the bulls since a lot of the economic problems have recently occurred and seems to be accelerating. I don't believe many ceo's were prepared three months back during the last earnings season in terms of their future guidance. Most taken by surprise by the recent down turn overseas as well as here at home. Maybe there will be more warnings than normal and I would expect no mercy since many p/e's are simply too high. Yum for instance. Crushed on bad news last night. Nus And Adbe as well. Many pre earnings warnings are occurring now. It doesn't look like a good season is upon us and if so, the ceo's should throw in the towel and guide way down so as to be to beat three months down the road during the next earnings season. You get the feeling the market isn't done with knocking out some stocks even though they've already been crushed. If you're bad on your numbers you will continue to get smoked so as always, be smart about what you hold in to those reports. I think this will be the toughest quarter in the past many years. All that sais, just know the numbers. 2000 to 2031 is key resistance on the Sp with 1954 both gap support and the 20 day ema. A day at a time with buying weakness the best way to proceed.
Please join us for a free 3 week trial at www.TheInformedTrader.com


