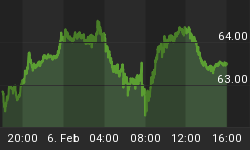
S&P500 moved nicely to the upside in the last few trading days and hit our 1970 projection as upward minimum objective. But notice that move up from yesterday was very strong so looks like market can be in wave 3 of a five wave move. If that's correct then price is headed back above 2011 for wave C) that represents final leg within a flat correction. If from any reason market will turn back down beneath 1928 then wave (B) can also be a triangle.
A Flat is a three-wave pattern labeled A-B-C that generally moves sideways. It is corrective, counter-trend and is a very common Elliott pattern.
Basic Flat Pattern:

S&P500, 4h

If you like our trading ideas, you can visit our website at --> www.ew-forecast.com


