


The following is part of Pivotal Events that was published for our subscribers September 29, 2015.
Precious Metals
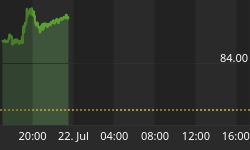
Precious on, precious off. It is just one darned thing after another.
The September 17th ChartWorks called for gold to rally to 1145 to 1185 window. From the 1110 level the rise made it to 1156 on Thursday. The September 20th review of the COT number conclude not to look for too much endurance on the rally.
Gold stocks (HUI) popped from 101 to 118. As with the August rally, the declining 50- Day ma ended the move. The 104 to 105 level has provided support five times since early August.
While this level may seem like longer-term resistance, gold stocks have been underperforming relative to the bullion price. Stability is needed.
The key low for GDX/GLD index was 120 on August 24th and the bounce was to the 50- Day at 135. Last week's low was 122 and today it is at 125. This, with the low of 119 in between, seems constructive.
Let's call it near-term stability. The declining 50-Day ma has been daunting, but it is beginning to flatten. This indicator rising through the moving average would be a positive step.
Another way of looking at it is through the GDX/SPX. This index has plunged from 572 in 2011 to 62 in early August. The rebound high was 82 and the next low was 64 in the middle of September. The last decline found support at the 50-Day and this week's trade is above the line. The moving average is beginning to flatten, which is constructive.
At 72, rising above 75 would be positive.
US Commercial Property Index

Source: GreenStreet
- Commodity bulls have been expecting a "Super Cycle".
- It seems to have appeared in commercial property.
- How long will it last?
US Junk (CCC) Yield

- The simple view is that the trend of rising yields has accomplished the second breakout from a cyclical low.
- This could be equivalent to the second breakout accomplished at 9.22% on November 16, 2007. Some three weeks after the high for the S&P.
- This breakout was set at 7.71% on Friday. It is now at 7.98%.
- The high on the last crisis was 23.26% set on December 15, 2008.
Gold Shares Divided By Gold

- Rising through the 50-Day moving average has been positive for the sector.
- The index is at 126, the 50-Day is flattening at 130.
- This is constructive, but not yet positive.
Link to September 29, 2015 Bob Hoye interview on TalkDigitalNetwork.com: http://talkdigitalnetwork.com/2015/10/credit-spreads-becoming-dramatic
Listen to the Bob Hoye Podcast every Friday afternoon at TalkDigitalNetwork.com


