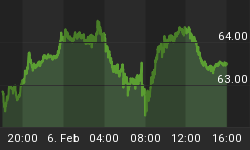
The dollar dropped about half a milligram gold, and 50mg silver.
But who wants to read about the universal currency falling, failing? Few people are so barbarous as to think of the dollar's value as being priced in terms a monetary metal. As all right thinking folks know, the value of these commodities is only whatever dollar price they may fetch. In that case, it's more exciting to report that popular betting commodities are back in a bull market.
"Gold went up $21 and silver went up $0.20."
OK that said, what we are always interested in is the fundamentals. Every week, we say, "read on, for the only true picture gold and silver supply and demand fundamentals." What do we mean by that?
Are Americans selling and China buying? How about Russia, India, and Turkey? We don't know if these trends are still true (or how true the reporting was when it was fresh). We do know that often by the time the retail speculators are ready to buy based on these stories, the market price has already moved, and the opportunity is gone (or the price has even overshot).
What if we divided the total money supply by the total (known, assumed) gold stocks? Would that tell us the right gold price? The resulting numbers of $5,000 or $8,000 or $30,000 are just wishful thinking. Nothing in the economy can be determined by dividing one aggregate measure by another.
Virtually every ounce of gold ever mined in human history is still in someone's hands. All of that metal is potential supply, at the right price and under the right conditions. However, we respectfully suggest that this is not bloody likely under current conditions.
Virtually everyone on the planet represents potential demand, at the right price and under the right conditions. This is the more likely scenario. What conditions are those? What if people fear that their counterparty (e.g. a bank) could default or impose "haircuts"? Then all bets are off, literally. You may see your heart's desired gold price, but be careful what you wish for...
For the meantime, this isn't happening. What is happening -- for years now -- is a pattern where speculators are the marginal buyers when the price rises and the marginal sellers when the price falls. How do we know this? We can see them push the price of futures up and down, relative to the price of physical metal. We watch this spread, called the basis, because it tells us what the marginal actors are doing.
Read on for, well ... you know the drill!
First, here is the graph of the metals' prices.
The Prices of Gold and Silver

We are interested in the changing equilibrium created when some market participants are accumulating hoards and others are dishoarding. Of course, what makes it exciting is that speculators can (temporarily) exaggerate or fight against the trend. The speculators are often acting on rumors, technical analysis, or partial data about flows into or out of one corner of the market. That kind of information can't tell them whether the globe, on net, is hoarding or dishoarding.
One could point out that gold does not, on net, go into or out of anything. Yes, that is true. But it can come out of hoards and into carry trades. That is what we study. The gold basis tells us about this dynamic.
Conventional techniques for analyzing supply and demand are inapplicable to gold and silver, because the monetary metals have such high inventories. In normal commodities, inventories divided by annual production (stocks to flows) can be measured in months. The world just does not keep much inventory in wheat or oil.
With gold and silver, stocks to flows is measured in decades. Every ounce of those massive stockpiles is potential supply. Everyone on the planet is potential demand. At the right price, and under the right conditions. Looking at incremental changes in mine output or electronic manufacturing is not helpful to predict the future prices of the metals. For an introduction and guide to our concepts and theory, click here.
Next, this is a graph of the gold price measured in silver, otherwise known as the gold to silver ratio. The ratio moved up slightly this week.
The Ratio of the Gold Price to the Silver Price

For each metal, we will look at a graph of the basis and cobasis overlaid with the price of the dollar in terms of the respective metal. It will make it easier to provide brief commentary. The dollar will be represented in green, the basis in blue and cobasis in red.
Here is the gold graph.
The Gold Basis and Cobasis and the Dollar Price

Again, we see this nearly pixel-perfect tracking of the price of the dollar (inverse of the price of gold in dollars) and the scarcity of gold. The price of gold has moved up due to buying of futures.
There is now no backwardation in gold. The December and February cobasis numbers are below zero.
That said, the gold market still looks tight. All cobases out on the term structure may be negative, but they are not too far from zero. Our calculated fundamental price hasn't moved much, and it's still another $80 above the market.
Now let's look at silver.
The Silver Basis and Cobasis and the Dollar Price

There is no backwardation in silver today either.
As the price rose, the silver basis (i.e. abundance) did rise slightly this week. But the cobasis did not fall.
The fundamental is now 40 cents below market.
Monetary Metals and the Perth Mint are sponsoring a seminar in Sydney on Oct 28, to discuss economics and markets, with a focus on how to approach saving, investing, and speculating. Please register here.


