


The market has rebounded strongly off the summer correction by shrugging off global-growth fears that dogged the market back in August. The S&P 500 fell 12.5% during the summer, and has since rebounded by 11.4% (Note: that doesn't mean the S&P 500 is back near its previous high). The worst third quarter for the stock market in four years has been followed by the best month for stocks in four years. The S&P posted its fifth straight week of gains, its longest such streak this year. The major indexes finished the past week flat with the S&P rising .2%; Dow Jones Industrial Average up .1% while the Nasdaq advanced .4%. For October, all three major indexes posted their biggest percentage increases since October 2011 as the Dow gained 8.5%, while the Nasdaq rose 9.4% and the S&P 500 rising 8.3 percent, led by energy and materials.

A standard chart that we use to help confirm the overall market trend is the Momentum Factor ETF (MTUM) chart. Momentum Factor ETF is an investment that seeks to track the investment results of an index composed of U.S. large- and mid-capitalization stocks exhibiting relatively higher price momentum. This type of momentum fund is considered a reliable proxy for the general stock market trend. We prefer to use the Heikin-Ashi format to display the Momentum Factor ETF. Heikin-Ashi candlestick charts are designed to filter out volatility in an effort to better capture the true trend. Last week we observed, "...It appears the MTUM is setting up to break out of the range into a new uptrend..." This observation is playing out at advertised. As highlighted in the updated chart below, the Momentum Factor ETF is in a confirmed uptrend with bullish momentum. The strength indicator is overbought, but this situation can last indefinitely and resolve itself as time passes.

Market Outlook
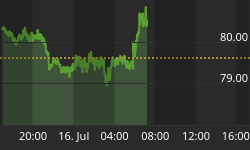
CNN Money reports that foreign direct investment into the U.S. hit $200 billion in the first half of 2015, a record high according to a report published Thursday by the Organization for Economic Cooperation and Development (OECD). It's a sign that global investors are optimistic about the U.S. economy at a time when the rest of the global economy undergoes a slowdown. As reported by the Investor Center, Investors will be looking at data over the next several weeks, including next Friday's employment report, for clues about the economy's health. The Fed signaled Wednesday a rate hike in December was still possible. "The market is being held a little bit hostage," said Jeff Buetow, chief investment officer at Innealta Capital in Austin. "It would be nice to have some clarity once and for all of what monetary policy is going to do over the foreseeable future." As evidenced in the chart below, bonds finished October lower after the Federal Reserve hinted at a potential December rate increase earlier this week, leading investors to dump bonds and use the funds to buy equities.

The CBOE Volatility Index (VIX) is known as the market's "fear gauge" because it tracks the expected volatility priced into short-term S&P 500 Index options. When stocks stumble, the uptick in volatility and the demand for index put options tends to drive up the price of options premiums and sends VIX higher. In a signal the market has stabilized, the CBOE volatility index fell 38.5 percent in October, its largest monthly percentage decline on record. As evidenced in the updated Volatility chart below, the VIX appears to trying to settle in at a support level around $15. This suggests that traders believe there is an element of risk in the current bullish move and they are not overly cavalier about the market. A dose of skepticism is healthy and supports our contention the market should grind higher heading into year-end.

The American Association of Individual Investors (AAII) Sentiment Survey measures the percentage of individual investors who are bullish, bearish, and neutral on the stock market for the next six months; individuals are polled from the ranks of the AAII membership on a weekly basis. The current survey result is for the week ending 10/28/2015. The most recent AAII survey showed 40.40% are Bullish and 20.60% Bearish, while 39.00% of investors polled have a Neutral outlook for the market for the next six months. We recently said, "...Individual investors remain underinvested compared to historical norms. As a reliable contrarian indicator, this signals the stock market should keep moving higher..." This prognostication proved to be valid. You can see retail investors bullish percentage is at historical norms in the current AAII survey. Since the current reading is not excessively bullish this supports the contention that the market should keep moving higher

The Nation Association of Active Investment Managers (NAAIM) Exposure Index represents the average exposure to US Equity markets reported by NAAIM members. The blue bars depict a two-week moving average of the NAAIM managers' responses. As the name indicates, the NAAIM Exposure Index provides insight into the actual adjustments active risk managers have made to client accounts over the past two weeks. The current survey result is for the week ending 10/28/2015. Third-quarter NAAIM exposure index averaged 56.15%. Last week the NAAIM exposure index was 35.00%, and the current week's exposure is 56.71%. Last week we commented "...The Federal Reserve Committee meets next week and if they continue to maintain a dovish position, expect NAAIM members to get on board and increase their equity exposure..." As most market pundits anticipated, the FOMC kept a zero interest rate policy. As we suggested, professional money managers responded by increasing their equity exposure. As quarterly earnings season progresses expect money managers to keep putting idle funds to use in the stock market.

Trading Strategy
As we have been saying recently "...this is the S&P 500's best October start since 2011 and good enough to be the eighth best start since 1950. Historically when the first nine trading days of October produced a gain, full month October finished with a gain 78.5% of the time..." This analysis came to fruition as this October had the strongest stock performance in four years. In the updated graph below, over the past month, all of the major S&P sectors finished the month higher. The fact that Cyclical, Materials, Industrials and Technology stocks are leading the current market push is a very positive sign for the strength of the market. These sectors are considered market leaders that normally perform well during market this time of year. Our recent analysis remains in play "...We expect the a bullish trend to continue for the rest year so that continuing to moderately increase bullish bets makes the most sense to us. Especially as quarterly earnings season progresses, solid numbers should continue to boost stocks..." Recently the market has exhibited a tendency toward late afternoon rallies. This is considered a sign of underlying market strength.

Feel free to contact me with questions,


