


One of the greatest contributions of Technical Analysis is to provide high probability Stock Market Buy and Sell signals from reliable time tested indicators. No indicator is perfect, but if we have access to a high probability indicator, that gives a trader a huge advantage. In this article I want to present four that I find particularly useful.
First, is the Purchasing Power Indicator, which is a proprietary momentum indicator we developed over a decade ago that has an impressive track record. Since our Purchasing Power Indicator generated a Sell signal on November 9th, the S&P 500 has declined 55 points and the Industrials have dropped 485 points. Prior to this Sell Signal, on October 5th, our Purchasing Power Indicator generated a Buy signal which was followed by a 1,201 point rally in the Industrials. Prior to that Buy signal, on July 24th, 2015 our Purchasing Power Indicator generated a Sell signal, which was followed by a 2,198 point mini-Crash in the Industrials. The time horizon for this indicator is to catch moves that typically last one to six weeks. What I like about this indicator is that if a trend suddenly reverses, it is smart enough to recognize that a new trend in the opposite direction is starting by issuing a new signal very fast after the new trend has started.

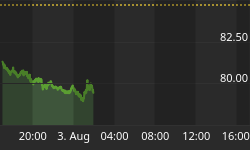
The next indicator I want to cover is our own proprietary Demand Power / Supply Pressure Indicator. Once again, this has an amazing track record of identifying new tradable trends with a Buy and Sell signal. We get a Buy signal once our Demand Power measure rises decisively above our Supply Pressure indicator. We get a Sell signal once our Supply Pressure measure rises decisively above our Demand Power Indicator. Pretty simple. This indicator also gives us early warnings of a coming trend turn with Bullish and Bearish divergences between the Demand Power measure and prices. Below is a chart showing its performance over the past few months. We provide this for Blue Chips, the NASDAQ 100, and for the HUI Mining stock index.


The next Indicator that provides excellent trend turn guidance is the Daily Full Stochastic chart. When the Fast and Slow measures rise above 90, it means the probability of am approaching stock market top is high. When they drop below 15, it means the probability of an approaching stock market bottom is high. Some people interpret a new Buy signal when the Fast measure rises above the Slow measure after both fell below 15. Some people interpret a new Sell signal when the Fast measure falls below the Slow measure after both rose above 90. Below is a chart showing this.

The fourth indicator that has a good track record for identifying potential trend turn moments is the Moving Average Convergence/Divergence measure. When we see a crossover of two moving averages of different time periods, this event can signal that the probability of a new directional trend is high.

While we use all four in our forecasting and trading evaluations, we lean heaviest on our Purchasing Power Indicator and Demand Power / Supply Pressure Indicator for the best precision.
Stocks continued their plunge Friday, November 13th, finishing their worst week since August 21st, 2015. Since McHugh's Purchasing Power Indicator generated a Sell signal on November 9th, the S&P 500 has declined 55 points and the Industrials have dropped 485 points. Prior to this Sell Signal, on October 5th, our amazing Purchasing Power Indicator generated a Buy signal which was followed by a 1,201 point rally in the Industrials. Prior to that Buy signal, on July 24th, 2015 our Purchasing Power Indicator generated a Sell signal, which was followed by a 2,198 point mini Crash in the Industrials.
Give yourself the investing advantage. You can renew or extend your standard subscription with our November special, 13 Months for Only $149 by going to www.technicalindicatorindex.com and clicking on either the Subscribe Today or Renew Today buttons.
Get a FREE 30 Day Trial Subscription to receive our Daily and Weekend U.S. and International Market Forecast Reports at www.technicalindicatorindex.com Simply click on the button at the upper right of the home page. We cover stock markets and Gold daily and have Buy / Sell signals. We also offer a Platinum Trading service. Email us at mainrdmch@aol.com for information on that program.
When did Noah build the ark? Before it rained. Well, it is starting to rain. We believe it is now time to make sure our arks are built and can float. We can help you at www.technicalindicatorindex.com with our daily and weekend market updates, or conservative portfolio model, and Platinum educational Trading program.
Do not be satisfied hearing what the market did; learn how to predict what the market is going to do. Join us at www.technicalindicatorindex.com as we study the language of the markets. Markets tell where they are headed. Technical Analysis is the science where we learn and apply the forecasting language of the markets.
Dr. McHugh's book, "The Coming Economic Ice Age, Five Steps to Survive and Prosper," is available at amazon.com at http://tinyurl.com/lypv47v
"Jesus said to them, "I am the bread of life; he who comes to Me
shall not hunger, and he who believes in Me shall never thirst.
For I have come down from heaven,
For this is the will of My Father, that everyone who beholds
the Son and believes in Him, may have eternal life;
and I Myself will raise him up on the last day."
John 6: 35, 38, 40


