• 710 days Will The ECB Continue To Hike Rates?
  • 710 days Forbes: Aramco Remains Largest Company In The Middle East
  • 712 days Caltech Scientists Succesfully Beam Back Solar Power From Space
  • 1,112 days Could Crypto Overtake Traditional Investment?
  • 1,117 days Americans Still Quitting Jobs At Record Pace
  • 1,118 days FinTech Startups Tapping VC Money for ‘Immigrant Banking’
  • 1,122 days Is The Dollar Too Strong?
  • 1,122 days Big Tech Disappoints Investors on Earnings Calls
  • 1,123 days Fear And Celebration On Twitter as Musk Takes The Reins
  • 1,124 days China Is Quietly Trying To Distance Itself From Russia
  • 1,125 days Tech and Internet Giants’ Earnings In Focus After Netflix’s Stinker
  • 1,129 days Crypto Investors Won Big In 2021
  • 1,129 days The ‘Metaverse’ Economy Could be Worth $13 Trillion By 2030
  • 1,130 days Food Prices Are Skyrocketing As Putin’s War Persists
  • 1,132 days Pentagon Resignations Illustrate Our ‘Commercial’ Defense Dilemma
  • 1,132 days US Banks Shrug off Nearly $15 Billion In Russian Write-Offs
  • 1,136 days Cannabis Stocks in Holding Pattern Despite Positive Momentum
  • 1,137 days Is Musk A Bastion Of Free Speech Or Will His Absolutist Stance Backfire?
  • 1,137 days Two ETFs That Could Hedge Against Extreme Market Volatility
  • 1,139 days Are NFTs About To Take Over Gaming?
The Problem With Modern Monetary Theory

The Problem With Modern Monetary Theory

Modern monetary theory has been…

Billionaires Are Pushing Art To New Limits

Billionaires Are Pushing Art To New Limits

Welcome to Art Basel: The…

  1. Home
  2. Markets
  3. Other

Elliott Wave Analysis: EURUSD And USDJPY

EURUSD

No change on EURUSD; pair made three legs up last week which is a structure of a corrective price action. We see a completed zigzag in wave four that should send price to new lows this week. Based on Fibonacci levels we see room down to 1.0580 this week. In the mean time 1.0830 must hood, otherwise wave count will have to be reworked.

EURUSD, 1H

EURUSD 1-Hour Elliott Wave Chart


USDJPY

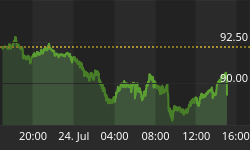
USDJPY has turned nicely up in the last few hours, which looks like an impulse that already broke out of the downward channel. At the same time we see move above 122.98 swing high that also suggests higher prices ahead. That said, it looks like that wave iv) finally bottomed as a double zigzag so traders must be aware of a continuation back to the November highs.

USDJPY, 4H

USDJPY 4-Hour Elliott Wave Chart


If you like our trading analysis, you can visit our website at --> www.ew-forecast.com


Back to homepage

Leave a comment

Leave a comment